| Analytics , IBCS Standards , SAP Analytics Cloud ,

When it comes to dashboard design, there are different schools of thought and approaches that developers follow. Each has its’ own set of best practices that help you build effective data visualizations. While each approach is unique and justified in its own way, I have tried to delve deeper into one such approach – IBCS (Dr. Hichert’s International Business Communication Standards). Though, most of the visual design principles in IBCS have been derived from the works of authors like William Playfair, Willard Cope Brinton, Gene Zelazny, Edward Tufte, and Stephen Few, what I personally love about IBCS is that they have a very structured approach to most dashboard design problems we face. There are well defined dos and don’ts with illustrated guidelines that make IBCS very easy to adopt and follow.
SAP Analytics Cloud is now IBCS certified which means that you can now create charts and tables that conform to the IBCS standards. Infact some of the standards are applied by default when you map the data which is like an icing on the cake
What is IBCS?
They are practical proposals for the design of business communication. Dr. Rolf Hichert took on a challenge to standardize the way analysts and controllers present data in their reports, dashboards and presentations and IBCS is the solution to his quest. Imagine if visualizations also had a standard, like electrical readings or a traffic signal, which anybody could understand and apply, and is the same everywhere. So IBCS standards are based on Hichert’s SUCCESS rules and are comprised of the following three pillars:
Conceptual rules – how to organize your content so that it gets your message across.
Perceptual rules – which visualizations to use in any given case.
Semantic rules – introduce the IBCS notation. This is the actual standardization of business communication. It covers the unification of all important and frequently used aspects of business communication: terminology, descriptions, dimensions, analyses, and indicators.
So, here are 7 reasons why your business should adopt to IBCS standards for your SAC dashboards:
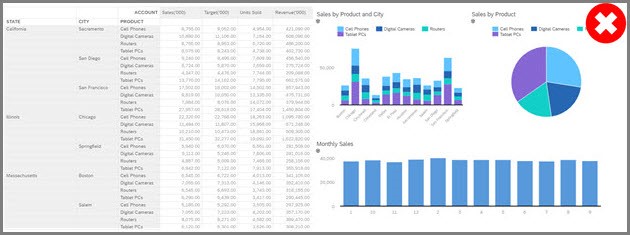
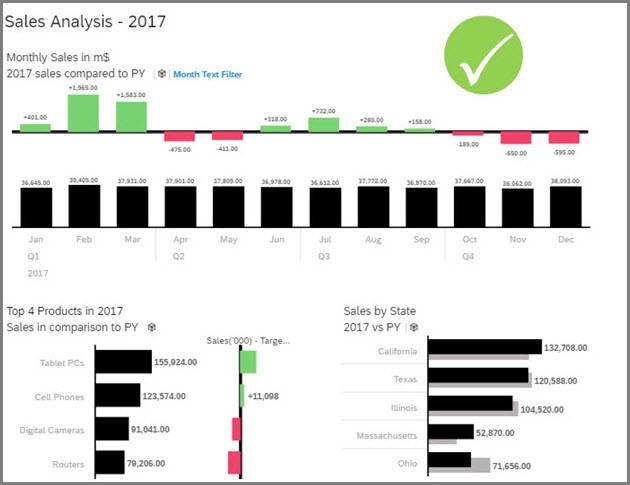
1. We want to gain key insights AT A GLANCE
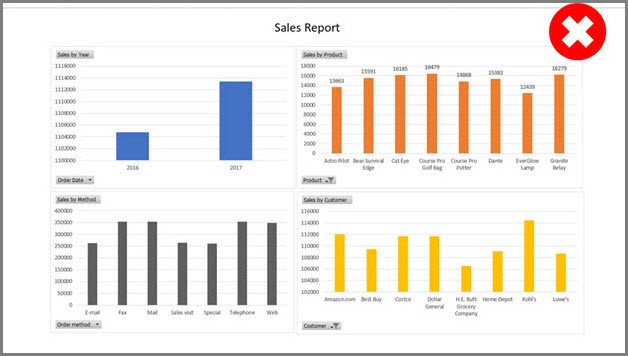
Most times, dashboards don’t convey the actual message immediately. Often we find ourselves reading through charts and spreadsheets trying to comprehend the data. But with IBCS, you get a gist of what you have to know (the facts) as soon as you look at the visualization. So this solves the first step to decision making – detection
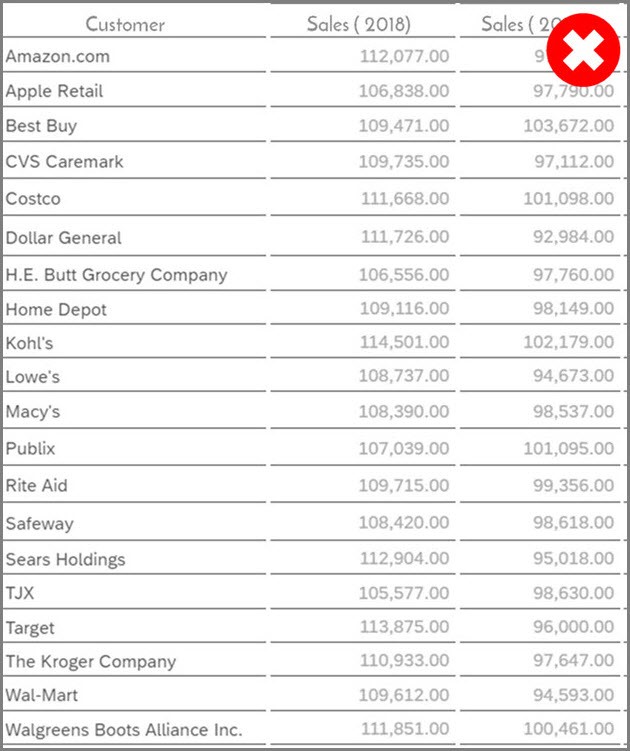
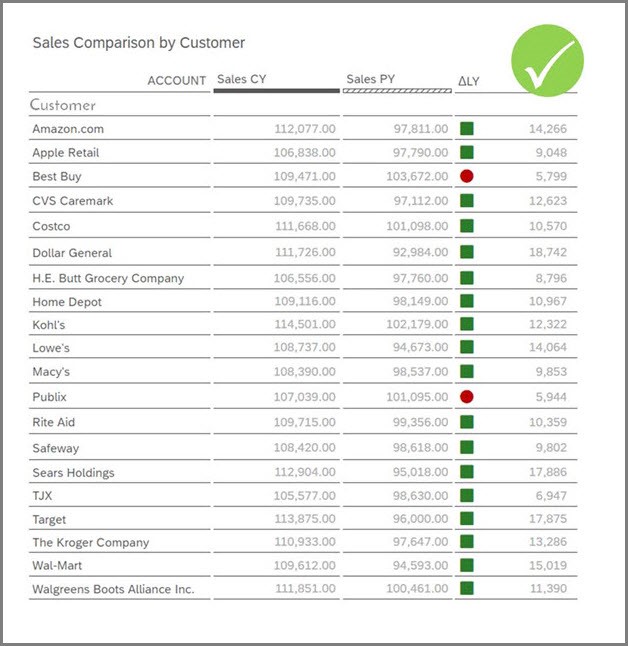
2. Our insights need to be actionable
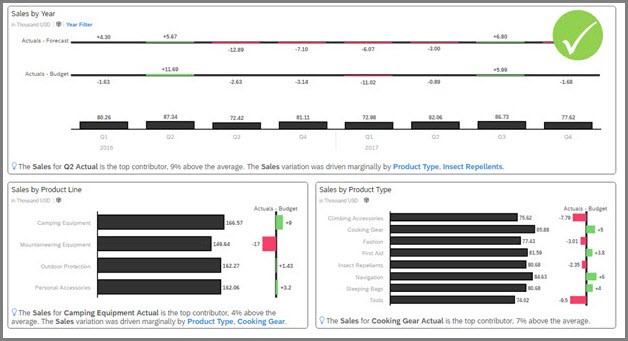
A Gartner Analyst once said that “BI is not there to let you know, it is there to let you act”. How many times have we come across a dashboard that just gives you the facts but does not tell you where the problem areas are or what you can do to improve the present scenario? The ultimate goal of a dashboard is to make the user, who has detected a problem, understand why there is a problem, help him make a decision and take corresponding actions. Explaining the reasons for a problem area and deriving a suggestion on how to solve the problem or at least on how to further proceed can add value to the dashboard. This is exactly what the conceptual rules of IBCS help us achieve.
3. Consistency is the key to success
One underlying rule of IBCS standard is to use the same expressions and the same visualizations for the same content. If the content is not the same, it should not look the same. Most times, the reports or dashboards that the CXO’s or decision makers receive from various departments are very different from each other – in terms of colors / shapes / notations and rules followed etc. Imagine how it would be if we can unify the appearance of all the reports within a company. It would avoid ambiguity which in turn will enable better decision making. IBCS provides us with a notation rule book that can be followed for all our visualizations and KPI’s across any domain. For eg. there is a clear cut way of differentiating actual from budget or one KPI from another KPI. So this helps maintain a consistency in reporting across the entire organization.
4. Time is our most precious resource
As far as reports or dashboard design is concerned, time factor plays a very important role. On one hand, there is the development time required to create your reports/dashboards. When there are no rules in place, each developer would have to start building every report right from scratch which in turn increases the dashboard development time. However, if there are a set of standardizations or rules, like in IBCS, developers can build re-usable templates which will reduce the dashboard development time to a great extent.
On the other hand, there is the time required to comprehend a dashboard. As discussed previously, most dashboards provide us with complex visualizations which take a long time to comprehend. But with IBCS, we have a standardization for the usage of charts and notations which facilitates easier comprehension and reduces the time needed to understand complex situations.
5. We don’t want to be mislead
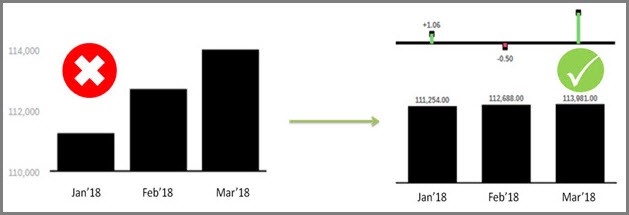
Visual integrity is one of the most important aspects for any dashboard design. If you have graphical representations which create an interpretation that differs from the actual underlying value, then the whole purpose of the representation is defeated. For e.g., we have come across dashboards which use different axes scaling or provide irrelevant information which drives you away from the reality. This has been addressed by the IBCS perpetual rules. There are rules like “Use identical scales for identical measure units” and “Use outlier indicators if necessary”, that help you build meaningful visualizations that wouldn’t mislead the decision maker.
6. It is better to be objective than subjective
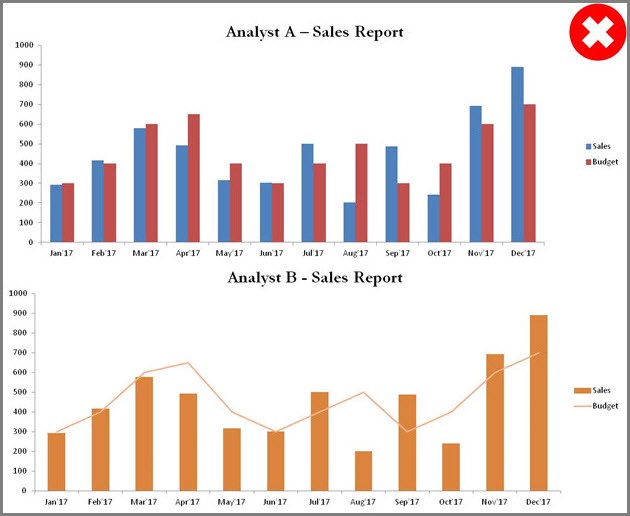
Most dashboards are often subjective than objective. Without standards in place, each dashboard designer gets to decide how he/she wants to visualize a certain KPI or what color scheme the report or dashboard should be in. While this helps in getting variety, it doesn’t solve the ultimate goal of better decision making. If a decision maker receives 5 types of sales report from 5 different analysts and each report has its own set of visualizations – for eg. Analyst A has denoted Sales in Blue in his report while Analyst B has denoted Sales in Orange in his report. This creates discrepancy and confusion. To avoid all this, IBCS standardization comes into play where you only use standard notations and same visualizations for the same content.
7. You already have the solid foundation laid by SAP Analytics Cloud
Now that we know there are a set of rules and standardization we can follow, how do we go about implementing it? Is it feasible to share ebooks, listing the standards and notations, across the company, for employees to use as a reference to develop their reports? Given the number of rules that we need to remember, it would be a very difficult solution. So here is where a software tool like SAP Analytics Cloud comes into play. The users don’t have to worry too much about the IBCS rules because SAP Analytics Cloud automatically ensures that the visualizations are IBCS compliant. They just need to prepare the data for different business scenarios and SAC ensures that the charts created from the data are IBCS compliant.
The trends in information design are rapidly changing. As IBCS rightly put, many specialized disciplines like engineering, music, and architecture follow a set of specific notation standards and so we should also start adopting standards for our reports and dashboards.