| Analytics , Power BI ,

Often, there are scenarios where we are looking for dynamically switching dimensions in Power BI for visualization granularity. In this blog, we have outlined the steps on how to dynamically switch dimensions as a selection for a chart using DAX queries in Power BI.
Step 1: Select “Import data to you model” or select any type of Import/Direct Query Connection
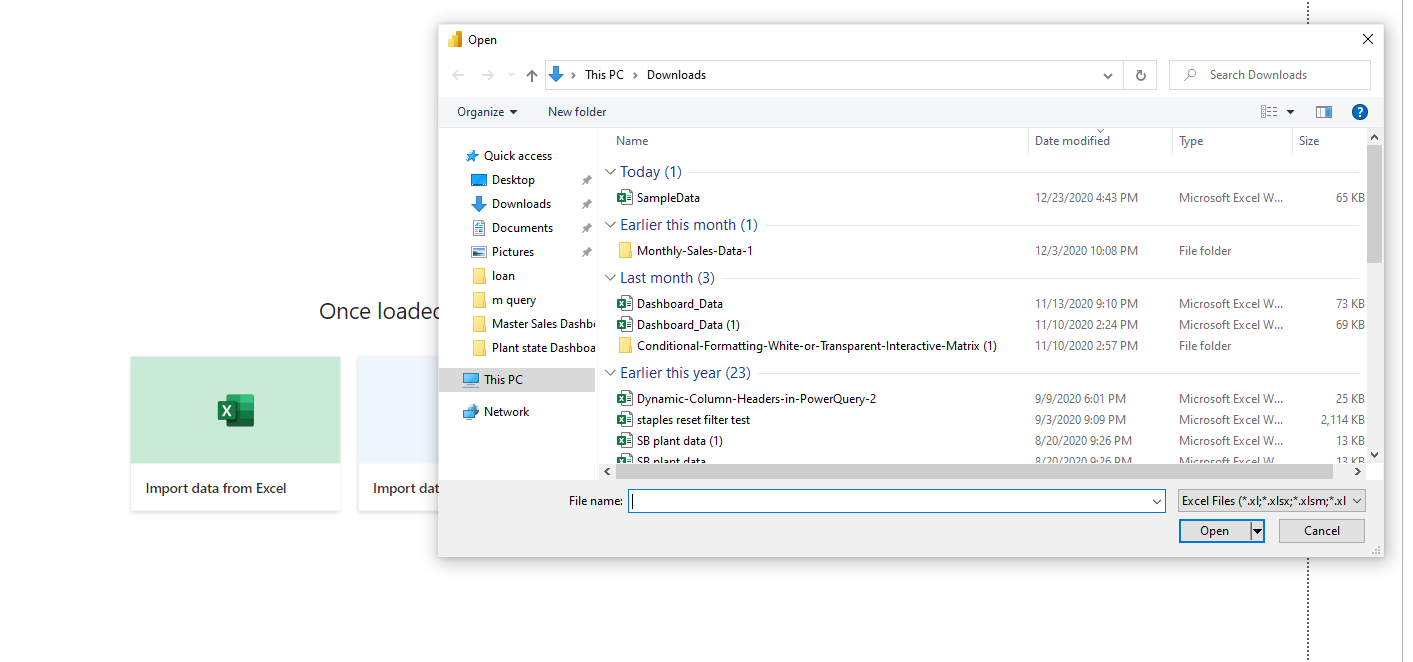
Step 2 : Select the File and upload the data into your Power BI desktop
Step 3: Now got to Modelling > New table and create a new by-code containing the logic for changing dimensions as shown below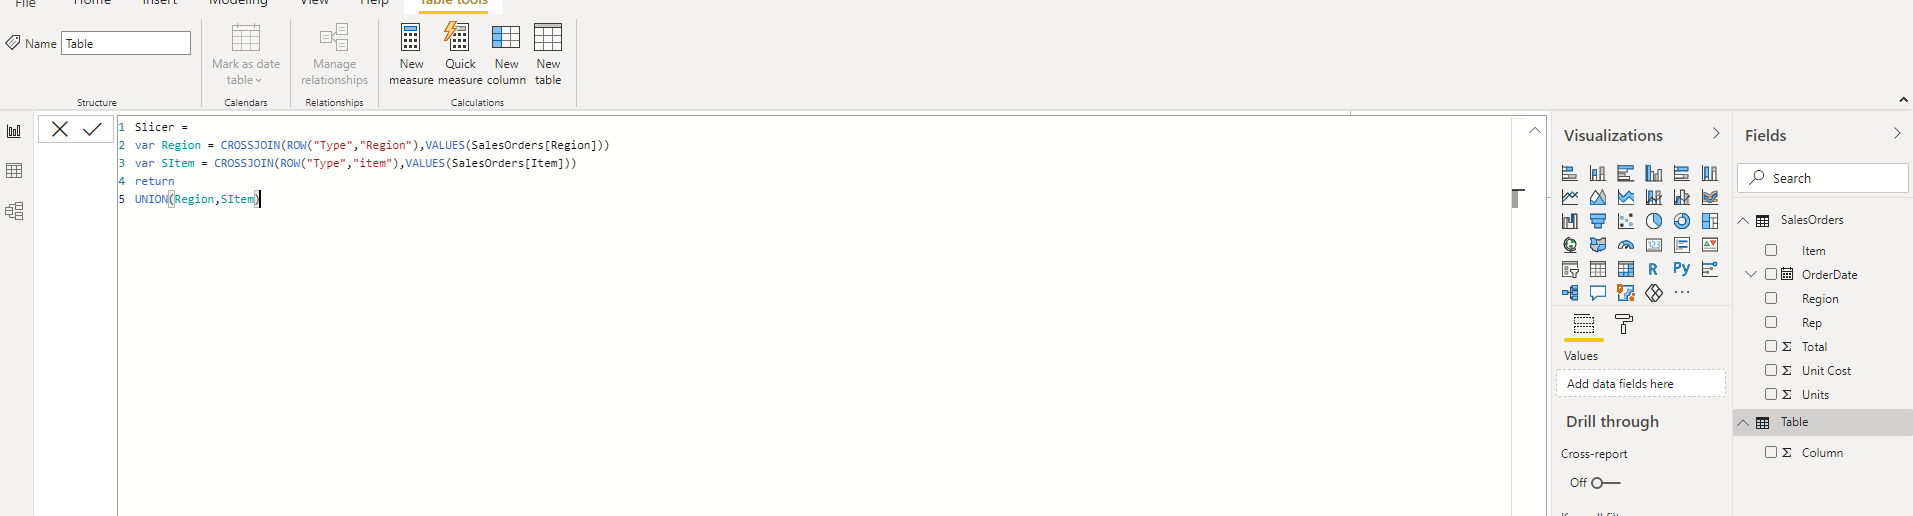
Slicer =
var Region = CROSSJOIN(ROW(“Type”,”Region”),VALUES(SalesOrders[Region]))
var SItem = CROSSJOIN(ROW(“Type”,”item”),VALUES(SalesOrders[Item]))
return
UNION(Region,SItem)
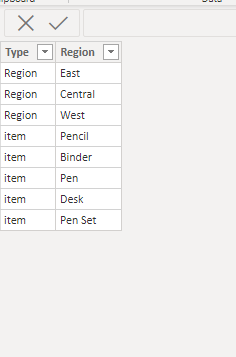
Step 4 : Table is created as shown below
Step 5: Now go Modelling>New Measure and create a measure which will show the values dynamically based on the selection values as shown below
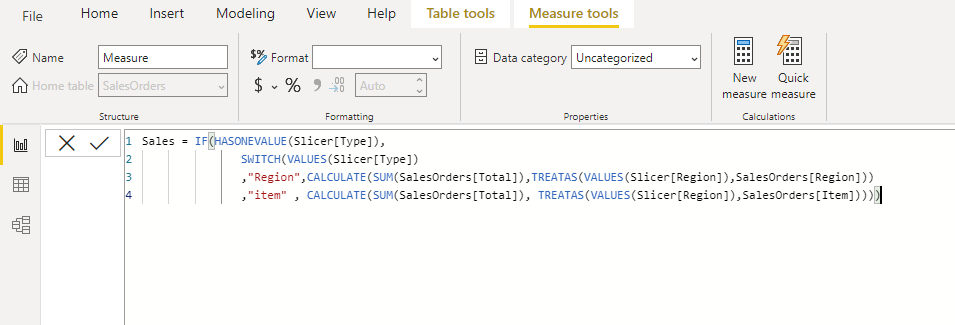
Sales = IF(HASONEVALUE(Slicer[Type]),
SWITCH(VALUES(Slicer[Type])
,”Region”,CALCULATE(SUM(SalesOrders[Total]),TREATAS(VALUES(Slicer[Region]),SalesOrders[Region]))
,”item” , CALCULATE(SUM(SalesOrders[Total]), TREATAS(VALUES(Slicer[Region]),SalesOrders[Item]))))
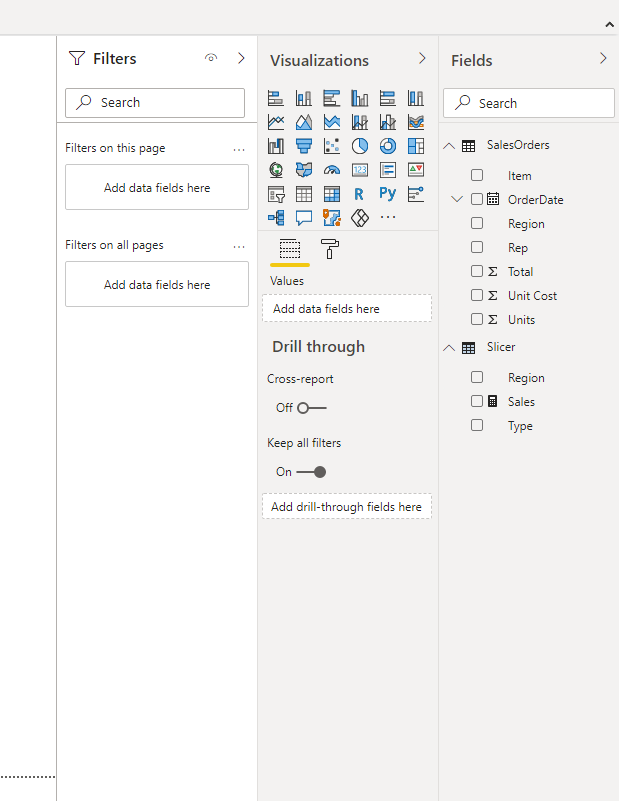
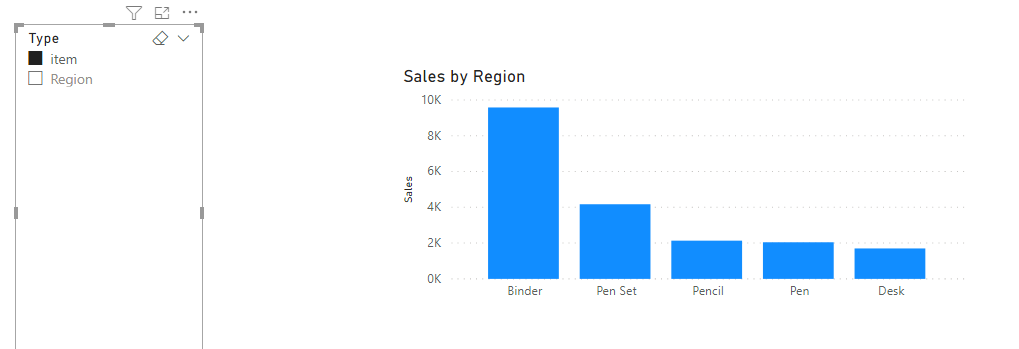
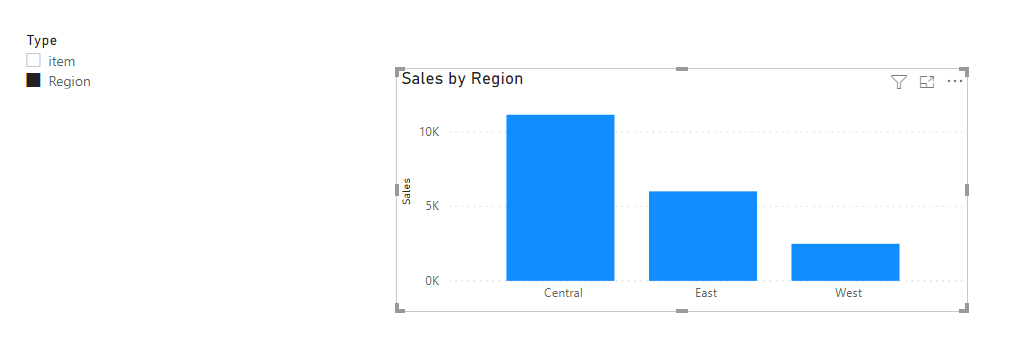
Once the measure is created, create a column type slicer and a chart using Region (Values column) in axis and Sales (Measure column) in values. You can now start dynamically switching dimensions in Power BI using the slicer and see the changes in the chart.
To learn more, get in touch with us today.