by Nine Boards Team | Analytics , Looker , Power BI , Tableau ,
With so many key players in the market, one important question that needs to be addressed is – Which Business Intelligence (BI) tool is better for my business? In this blog, we compare three of the market leaders in BI – Tableau, Power BI and Looker. These reporting platforms have been compared across different features […]
by Rajitha Madineni | Analytics , Looker ,
Adding drill through feature to your visualizations enable users to look into different layers of data granularity and analyse hierarchical data. In this blog we have explained how you can apply drill through functionality in Looker. Step 1: Login to Looker web and select the data under Explore menu bar. Step 2: Once you select […]
by Rajitha Madineni | Analytics , Looker ,
It is important to draw attention to data points that causes critical changes to your data. This is when the Conditional Formatting feature comes handy. Conditional formatting for charts is very useful to gain insights about the performance of your data. In this blog, we will walk you through the steps for creating a chart […]
by Nine Boards Team | Analytics , Looker ,
Looker is a Business Intelligence platform that empowers organizations to create powerful data experiences and get more value out of their data. The data in Looker is modeled using LookML which is one of the key differentiating features of Looker. With LookML, you can define the relationships between datasets and explore the data directly thus […]
by Rajitha Madineni | Analytics , Looker ,
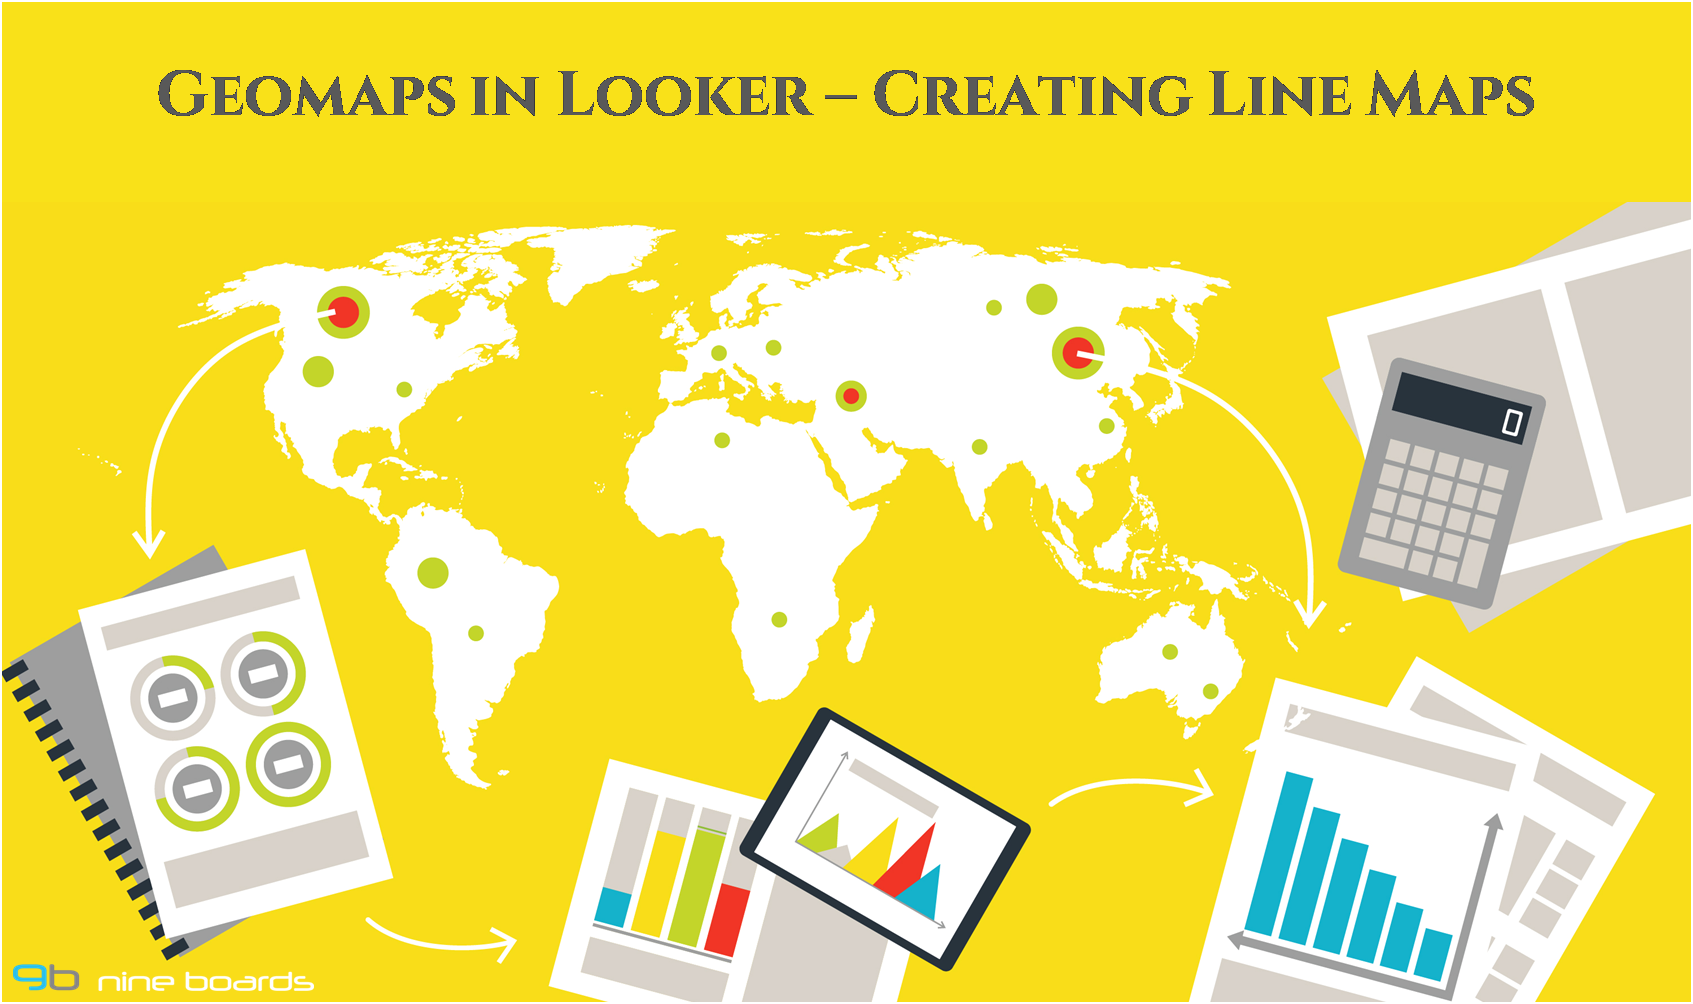
There are scenarios where businesses want to analyse the”where” and “why” of their data. There is no better way to perform this analysis than using a GeoMap. Looker has got you covered to perform all kinds of geographic data analysis with your data. In this blog we are going to see how you can add […]