| Analytics , Looker ,
There are scenarios where businesses want to analyse the”where” and “why” of their data. There is no better way to perform this analysis than using a GeoMap. Looker has got you covered to perform all kinds of geographic data analysis with your data. In this blog we are going to see how you can add a Geomap and create a connecting line map in Looker.
To create geomaps in Looker, it is important that your data contains at least one dimension which is a geographic data . The geographic data can be one of the following:
Here are the steps to create a line map in Looker.
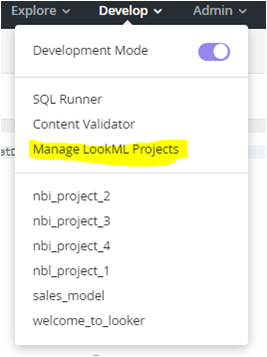
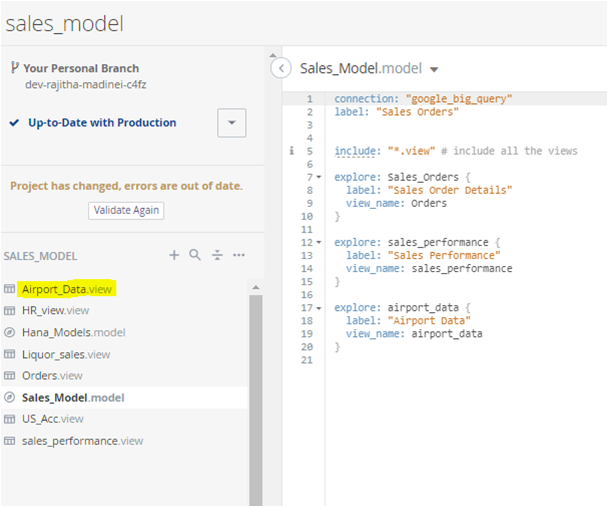
Step 1: In Development mode, go to Develop>Manage LookML Projects
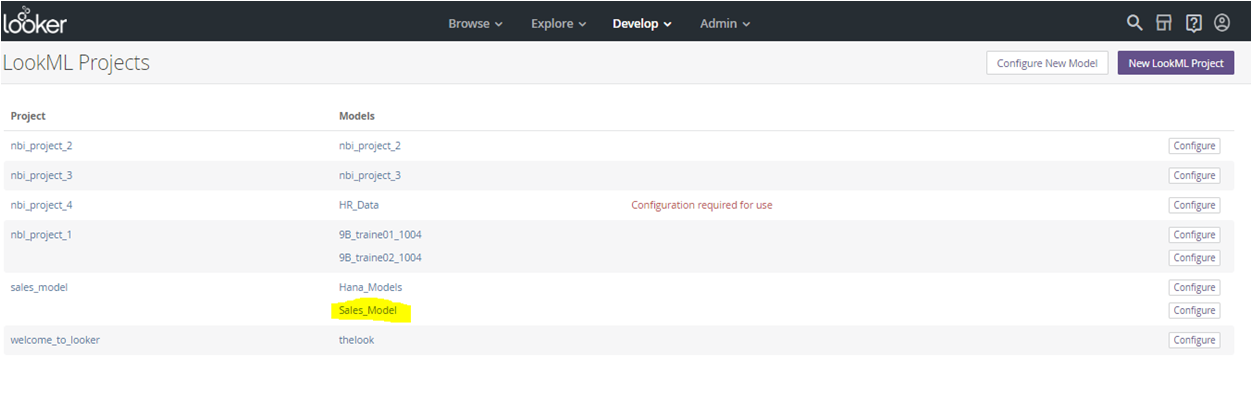
Step 2: Select a project and a model which has the geodata. In this blog, I have selected the “Sales_Model”. In Sales_Model I have selected Airport_Data.
You can also create a new project and create your own data.
Step 3: The data I have used has a dimension called “Destination_City” which is a String datatype. To convert the string type dimension to a location dimension, add a custom LookML code as shown below. “Dest_City” is the location dimension we will be using in our Looks.
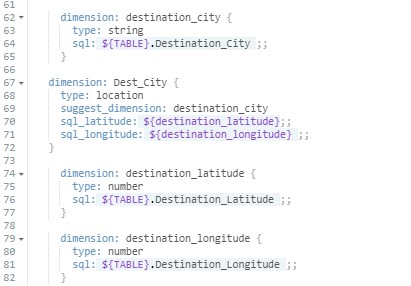
Step 4: Save the LookML code and execute, commit, and deploy the changes.
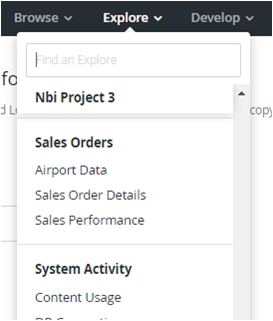
Step 5: Navigate to the project under the Explore menu and select the data. Here we will select Airport Data.
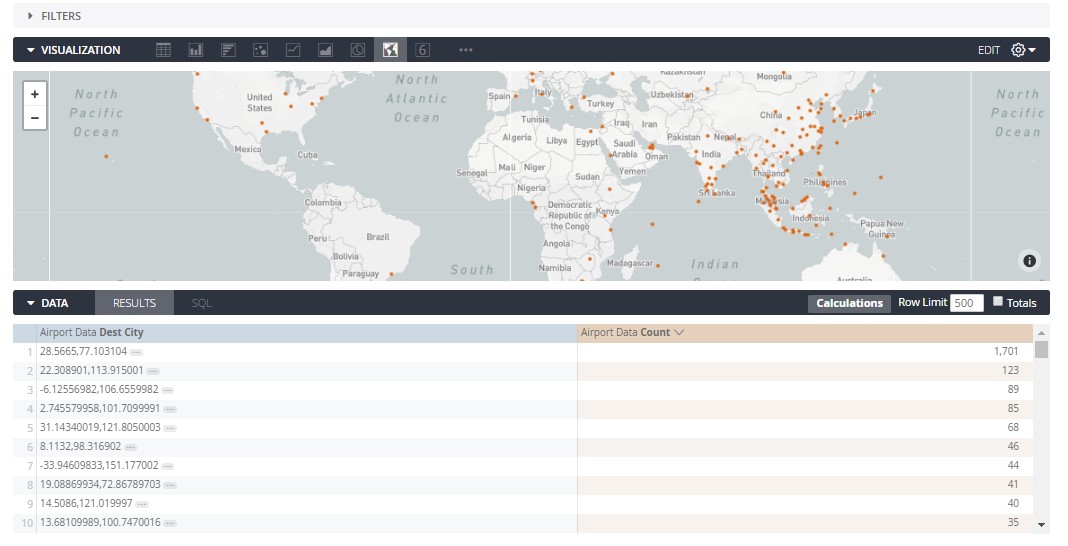
Step 6: Select the dimension “Dest_City” and a measure (I have selected Count) then click on the “Run”.
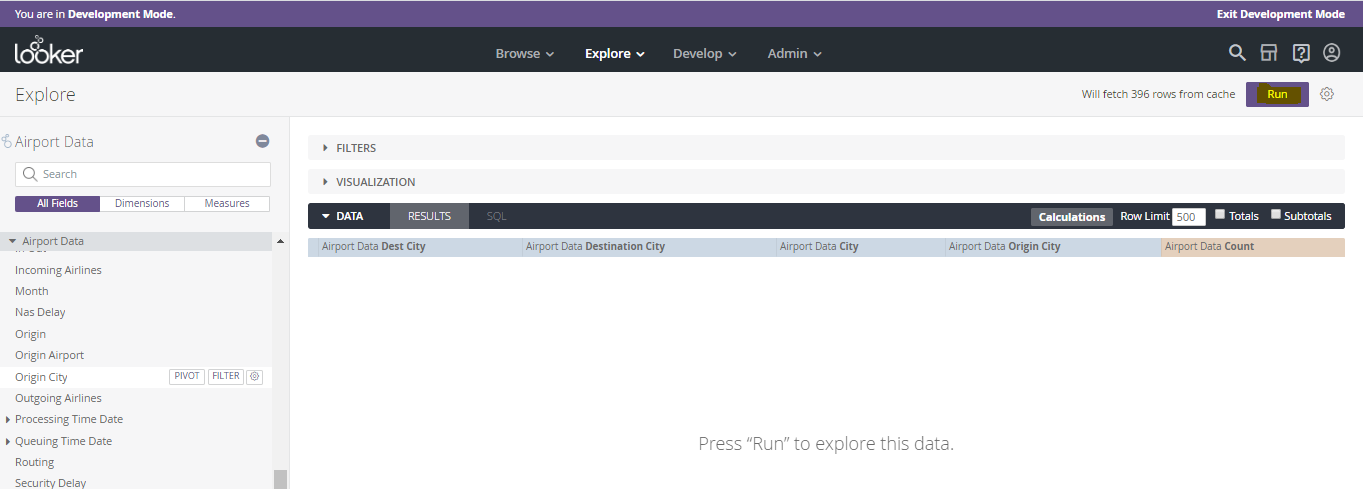
Select the map visualization. As you can see, the data points are mapped according to the locations given in the dataset.
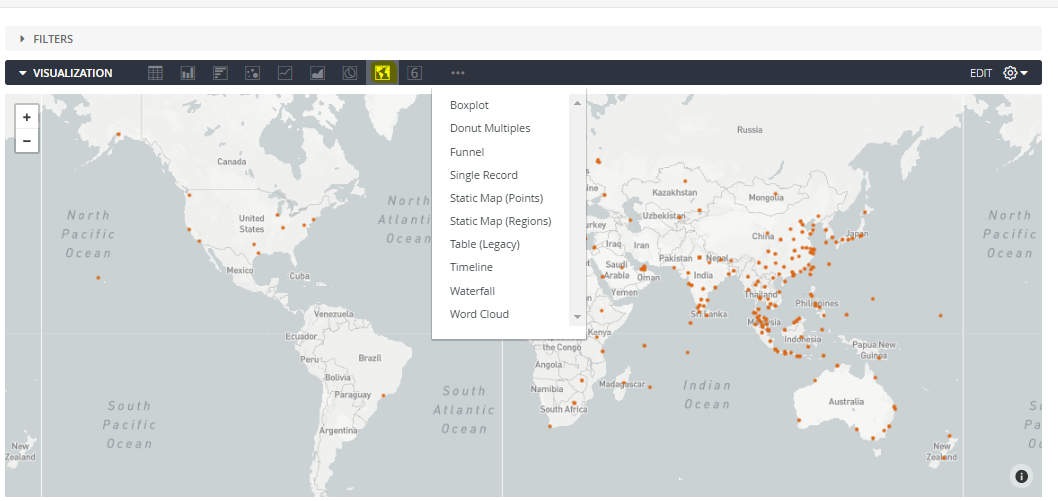
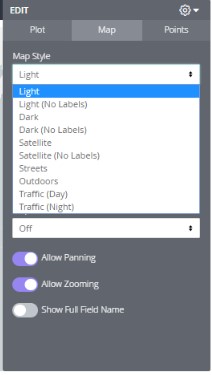
Step 7: There is an “EDIT” option on the top right corner of the map visualization where you can change the map style.
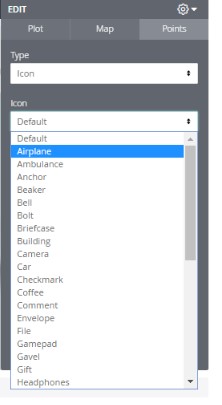
Step 8: You can also select an icon type of the data points as shown below. I have selected the Airplane icon type.
Step 9: You can select a dimension name to be displayed in the Tool Tip. I have selected “Desitination_City”. Once we click on Run, the map will be displayed as shown below. Upon clicking any of the location data point, the city name and count of Airports in that particular location is displayed in the tooltip.

Step 10: Once you have created the geomap, you can now add connecting lines to the map.
Note: To create the map with connected lines, you can only use ‘Location’ type dimension. ‘Map Layer’ type is not accepted.
To create the Connecting Lines , follow Step 1 to Step 5 as listed above and while selecting dimensions in Step 6, you need to select two location dimensions (origin and destination) and a measure. Here I have selected “Origin_City” and “Destination_City” for dimensions and “Count” as measure. Click on Run.
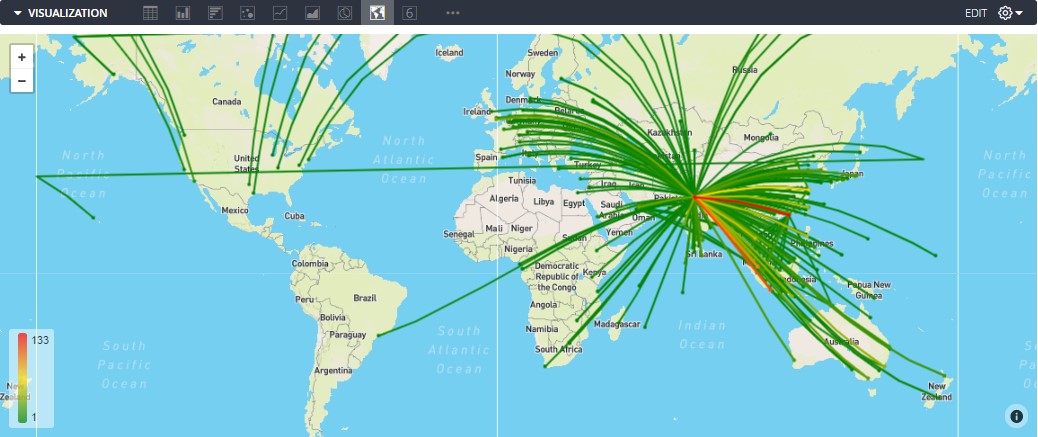
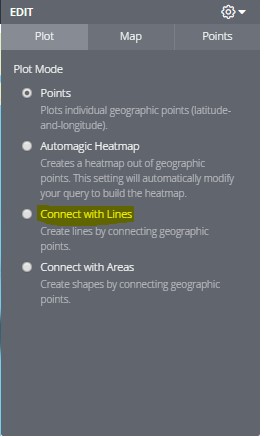
Step 11: Under Edit>Plot , select “Connect with lines”.
As shown below, the map is displayed with connecting lines across geographic locations.