| Analytics , Looker ,

It is important to draw attention to data points that causes critical changes to your data. This is when the Conditional Formatting feature comes handy. Conditional formatting for charts is very useful to gain insights about the performance of your data. In this blog, we will walk you through the steps for creating a chart with conditional formatting in Looker using “Table Calculations”.
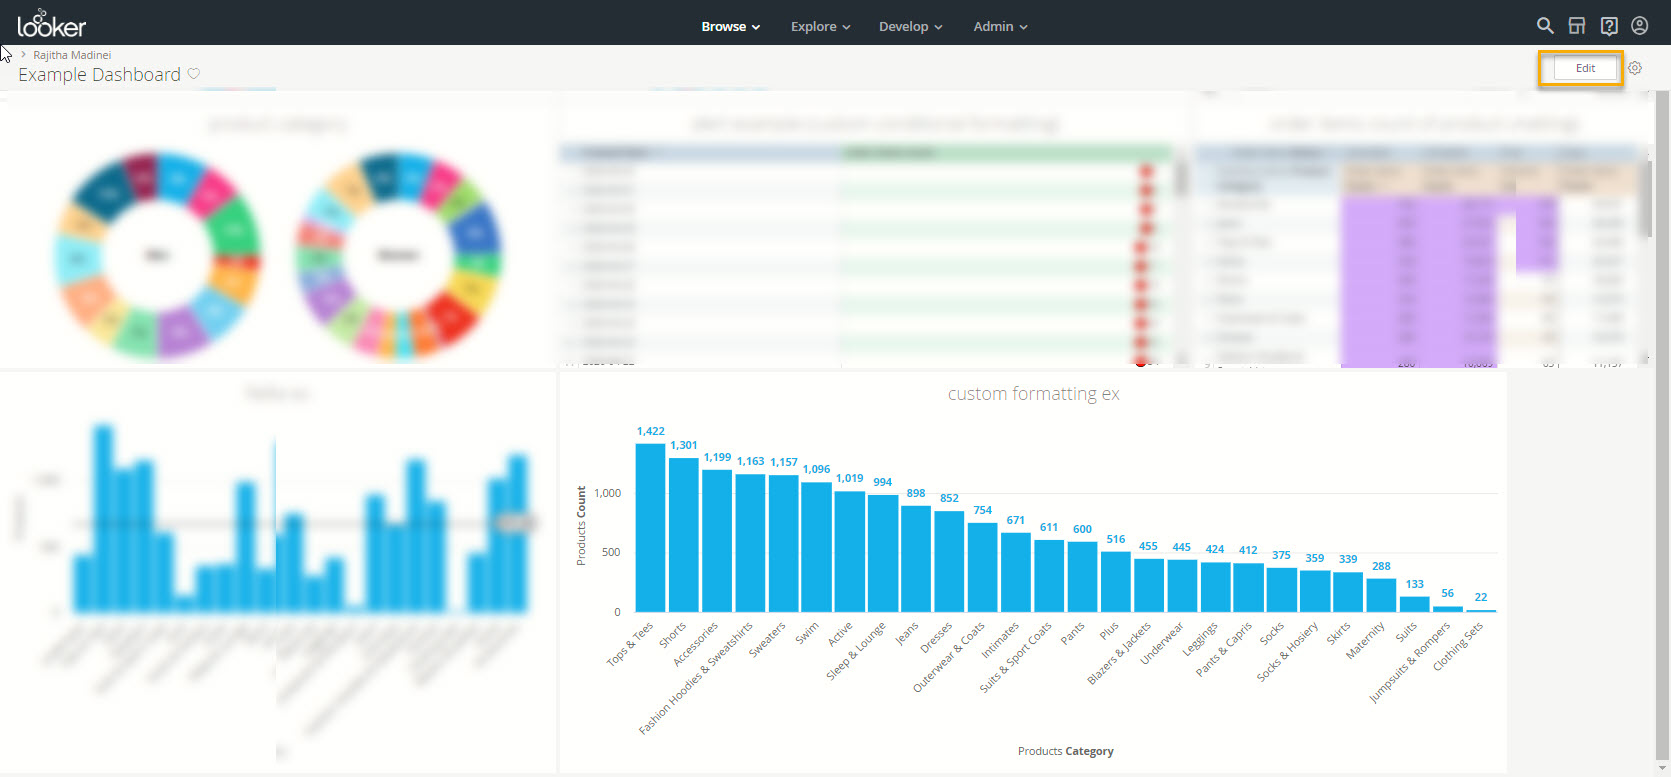
Step 1: Open your Looker dashboard. Click on the “Edit” option in the top right corner of the dashboard as shown below.
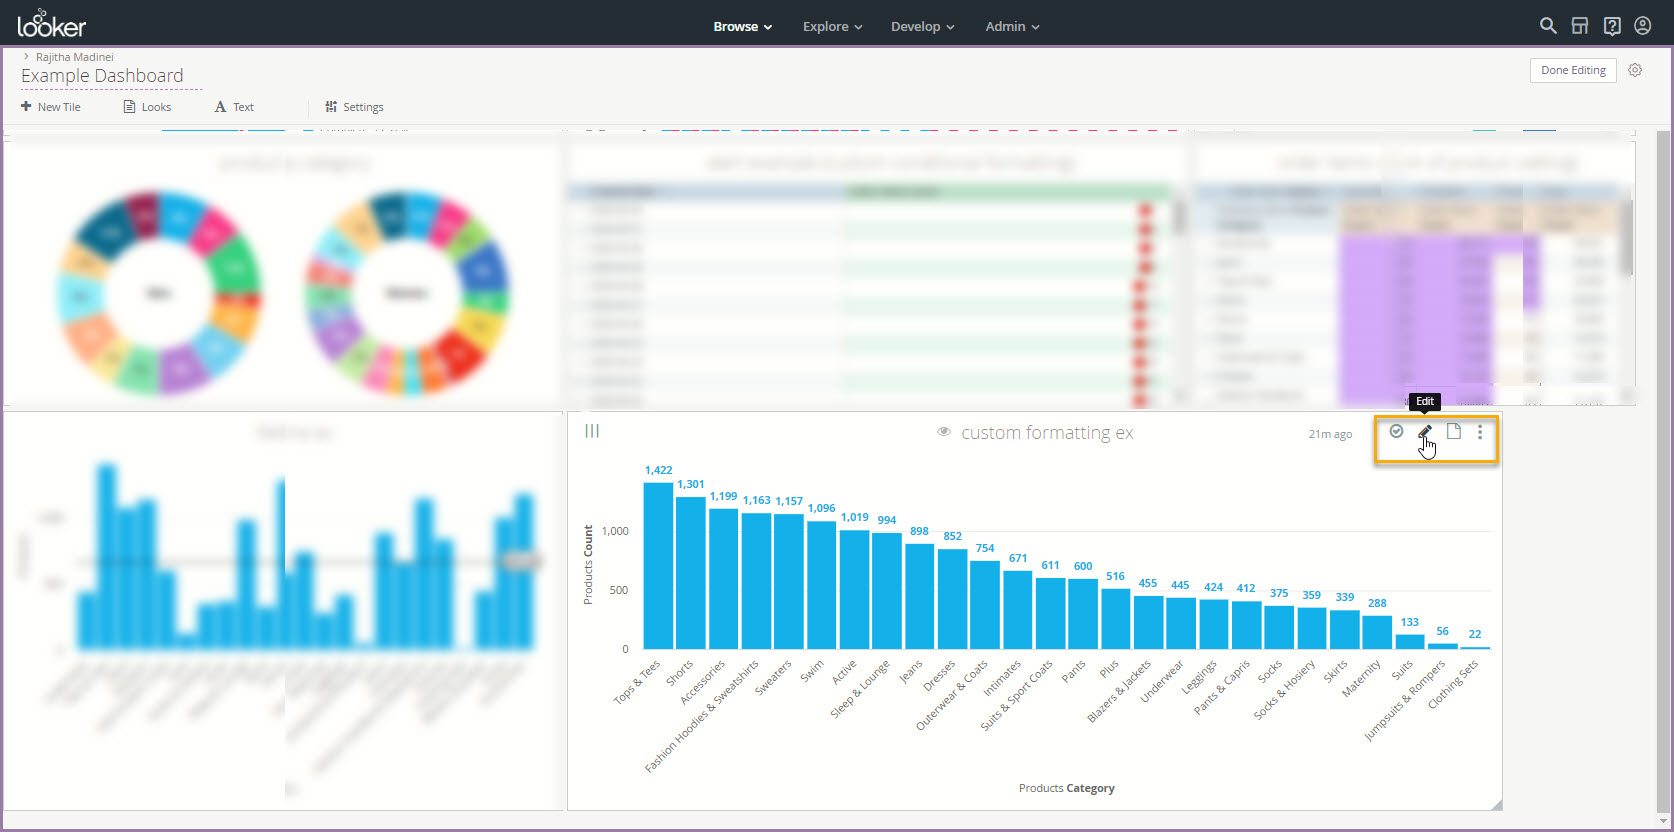
Step 2: Pick one of the chart’s in the look and then click on the Edit symbol on the right corner of the look as shown below. In this example we have used a chart with “Product category” and “Product Count” data.
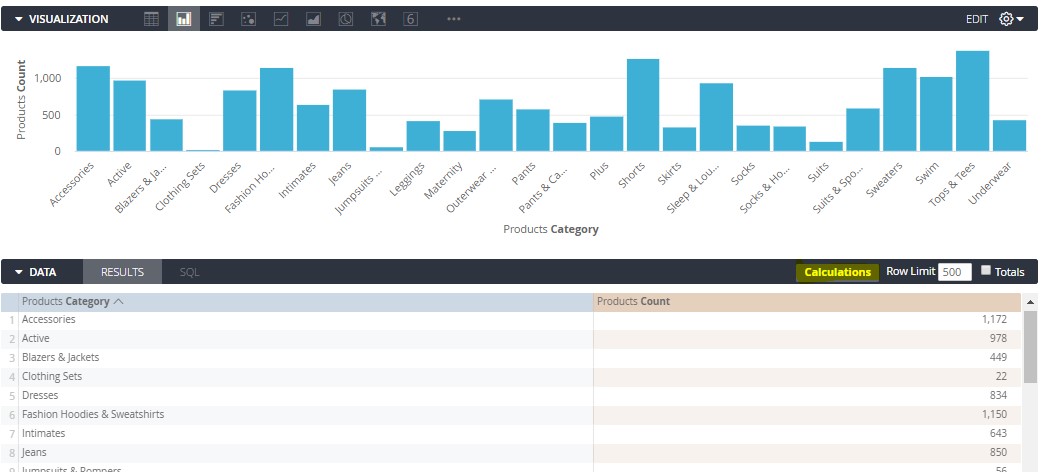
Step 3: A window as shown below appears. Click on the calculation option (highlighted) on the top right corner of the data bar as shown below.
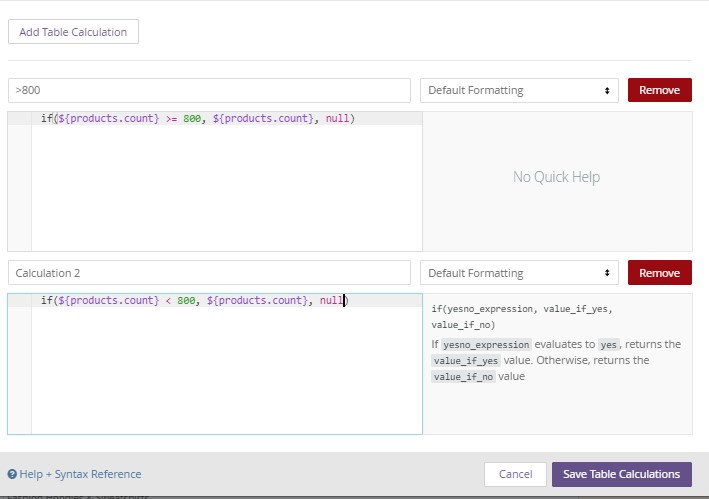
Step 4: Click on the calculation field and a window will pop up. Type in the calculation name and formula, then click on “Save Table Calculations”.
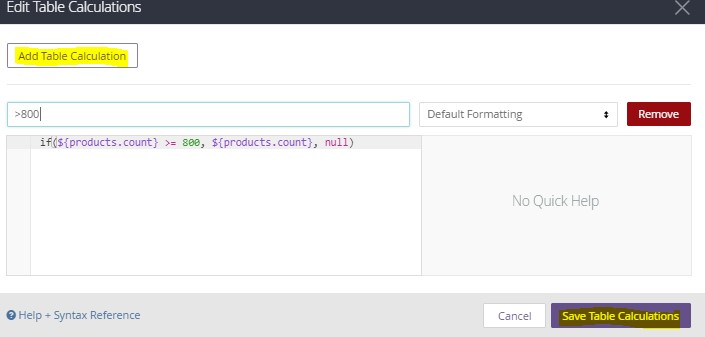
Step 5: Once done, it will display values that are >800. For values <800 create another calculation field by clicking on “Add table Calculation” as mentioned above.
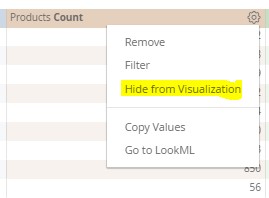
Step 6: Now, hide the original data from the visualization – click on the gear icon and select “Hide from Visualization” as shown in below.
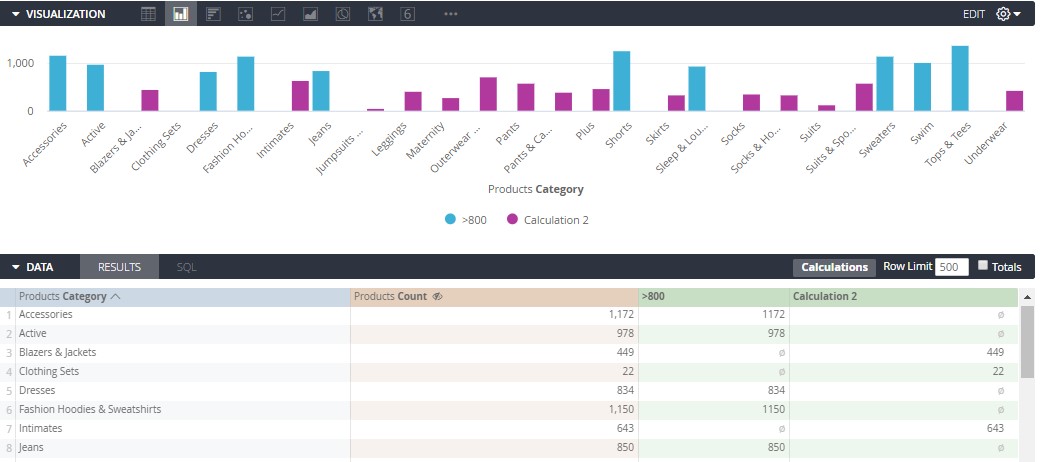
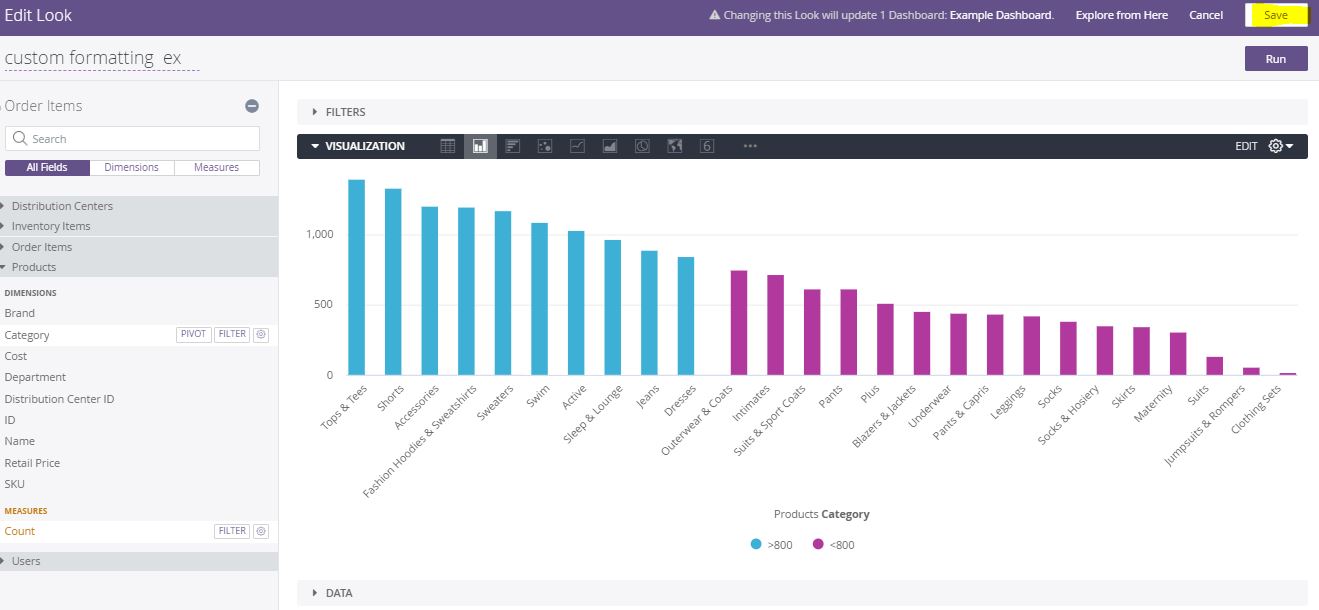
Step 7: The visualization will appear as shown below.
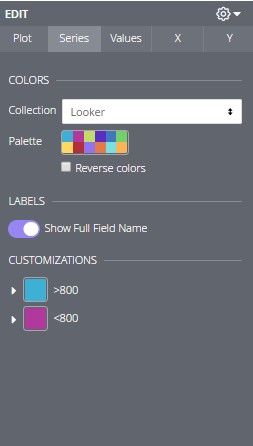
Step 8: You can change the colors of the data points by clicking on the gear icon in the visualization bar as shown below.
Step 9: Sort the count as ascending or descending and save the changes of the look by clicking on the Save in the top right corner of the Look (highlighted below).
Step 10: The look will now appear as shown below. Click on “Done Editing” on the top right corner of the dashboard.
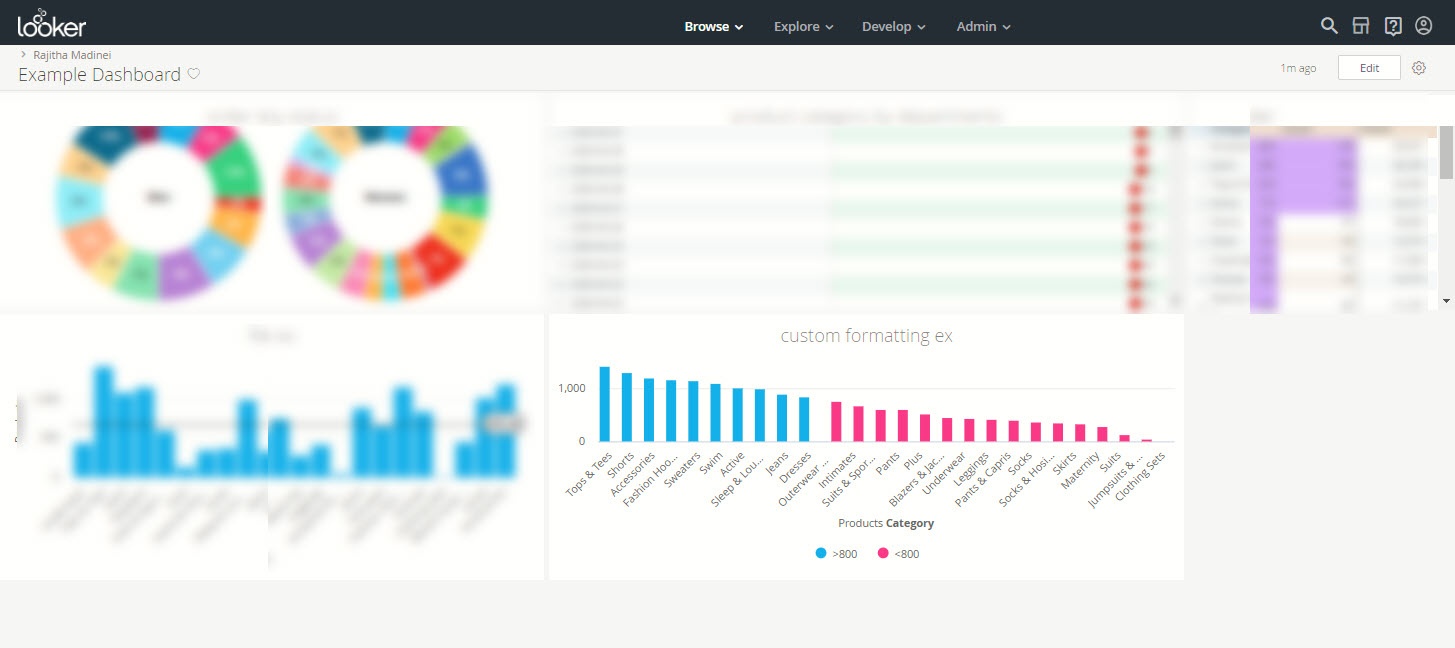
Conditional formatting has been applied to the chart. For more information on conditional formatting for Looker, contact us.