| Analytics , Looker ,

Adding drill through feature to your visualizations enable users to look into different layers of data granularity and analyse hierarchical data. In this blog we have explained how you can apply drill through functionality in Looker.
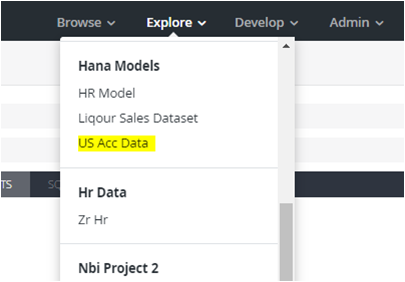
Step 1: Login to Looker web and select the data under Explore menu bar.
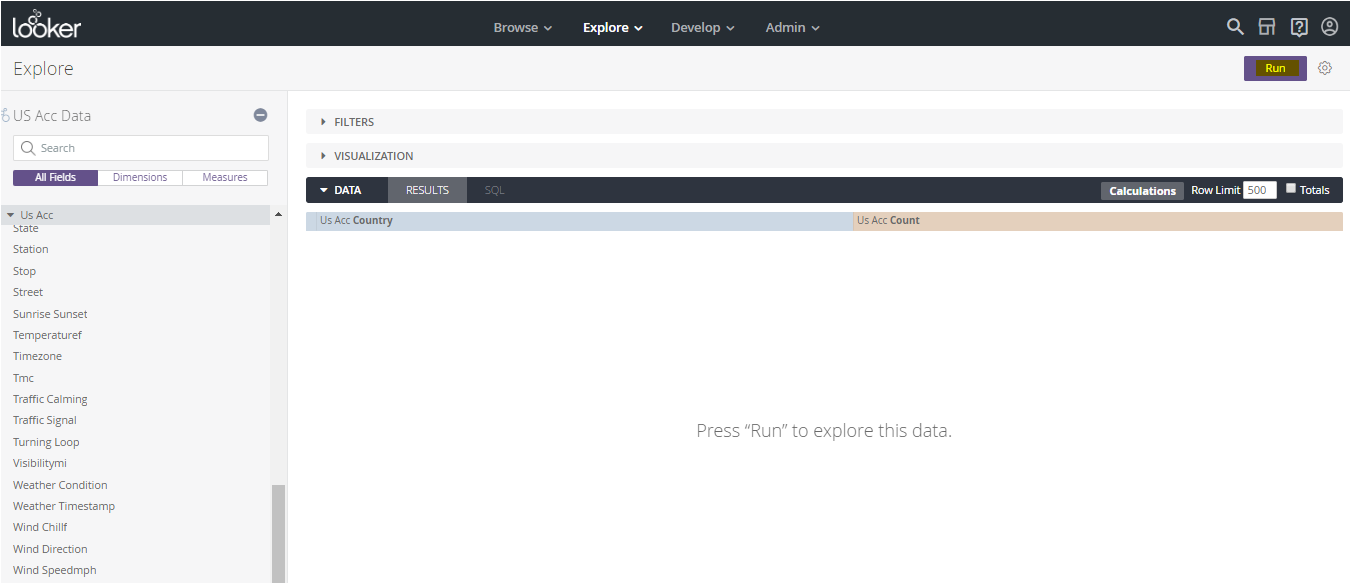
Step 2: Once you select the data, the following window will appear.
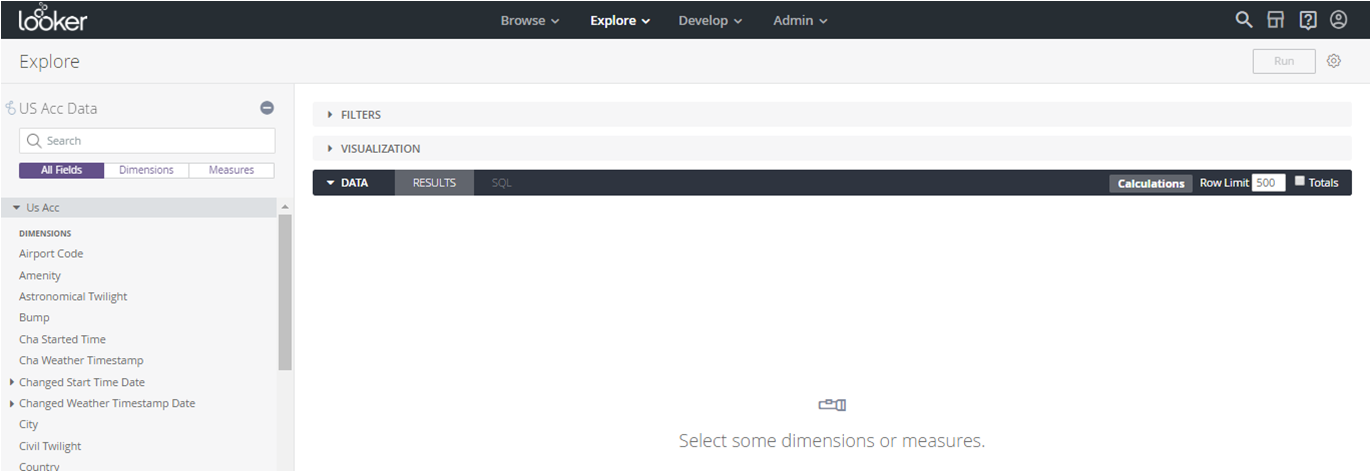
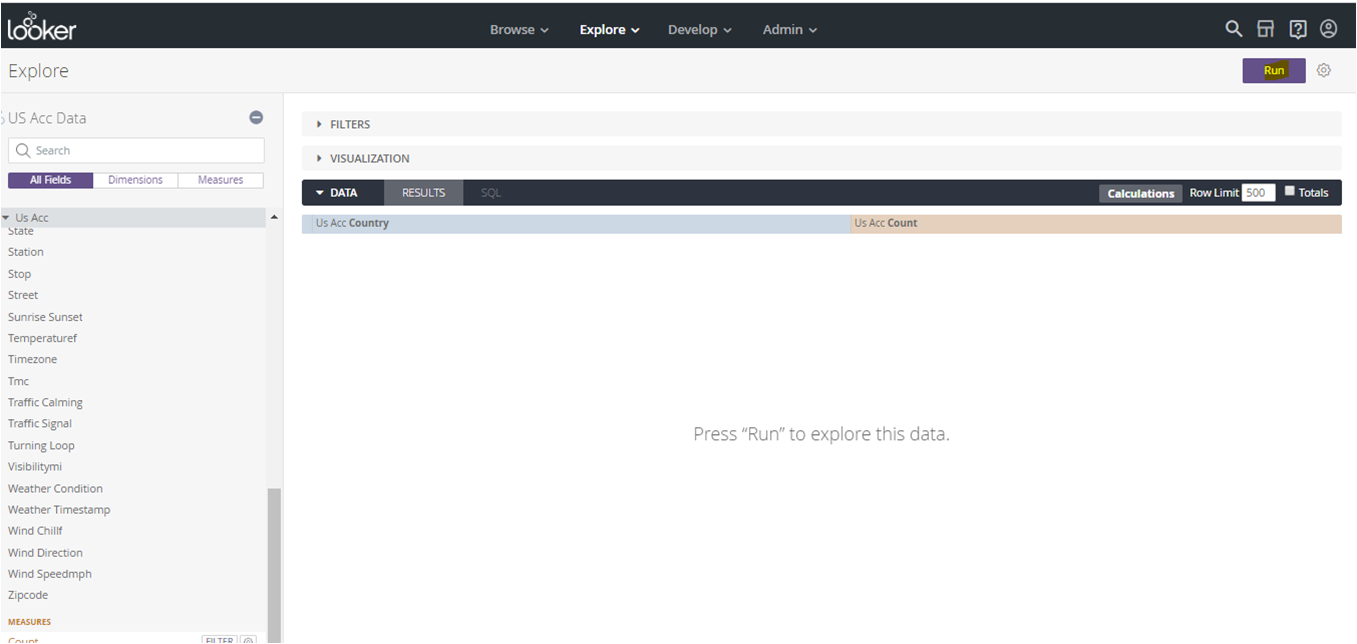
Step 3: Select a dimension and measure. In this example, I have chosen “Country” as the dimension and “Count” as the measure. Click on “Run” at upper right corner of the window as shown below.
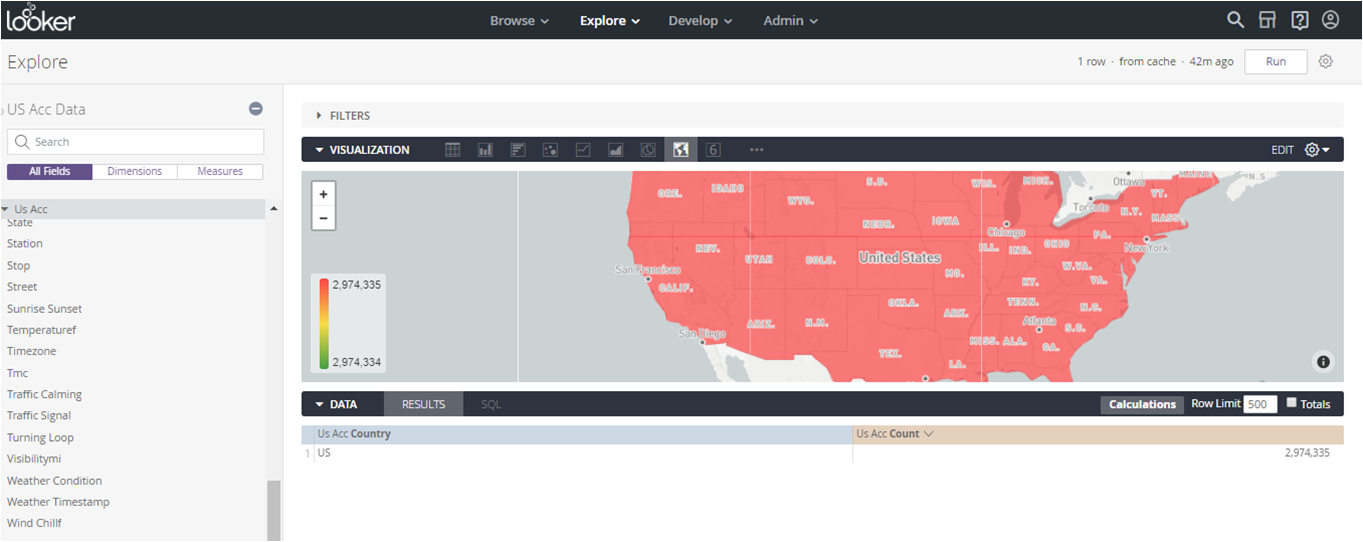
Step 4: After running the data, the following window will be displayed.
Step 5: Enable the “Development mode” under Develop menu and select “Manage LookML Project”.
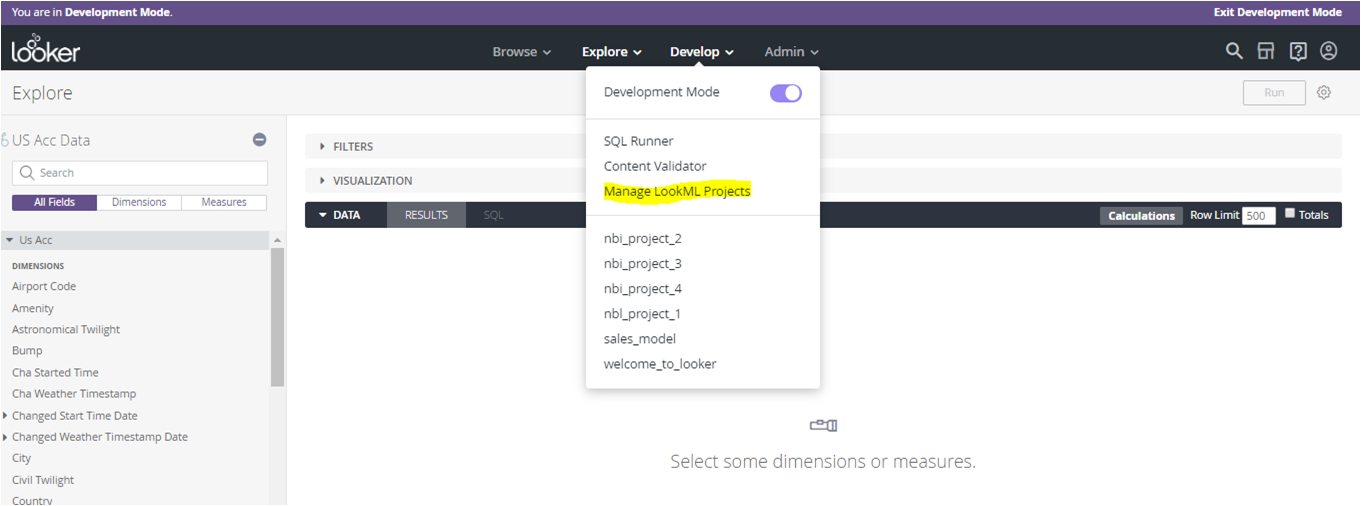
Step 6 : Select the required Project model as shown below.
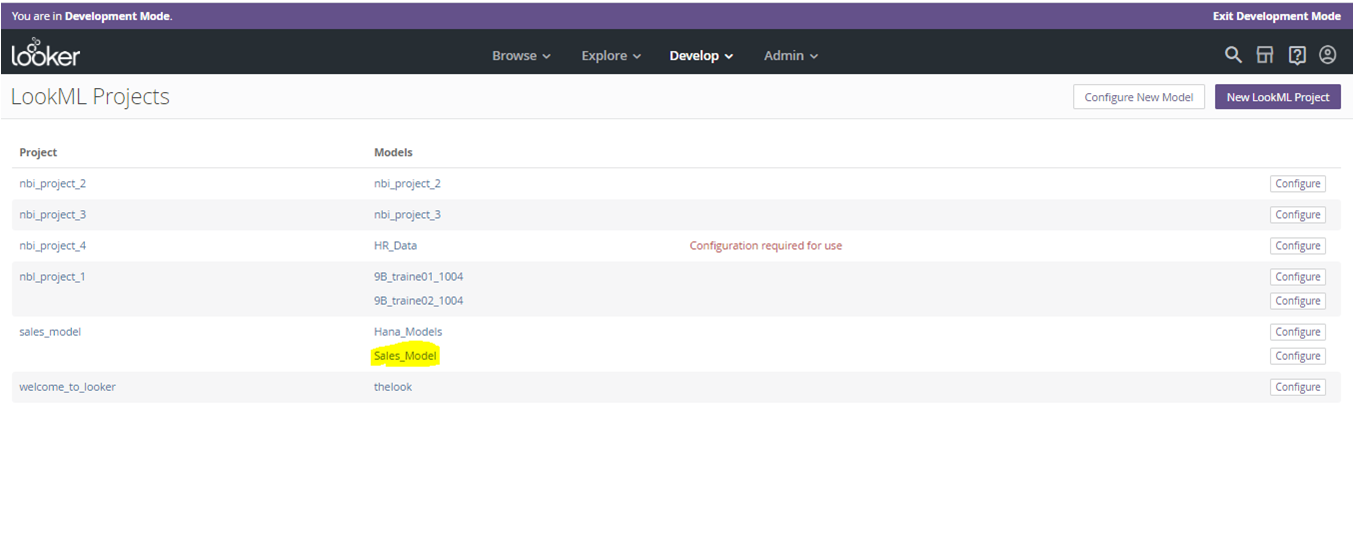
Step 7: After selecting the “model” a window as shown below will be displayed.
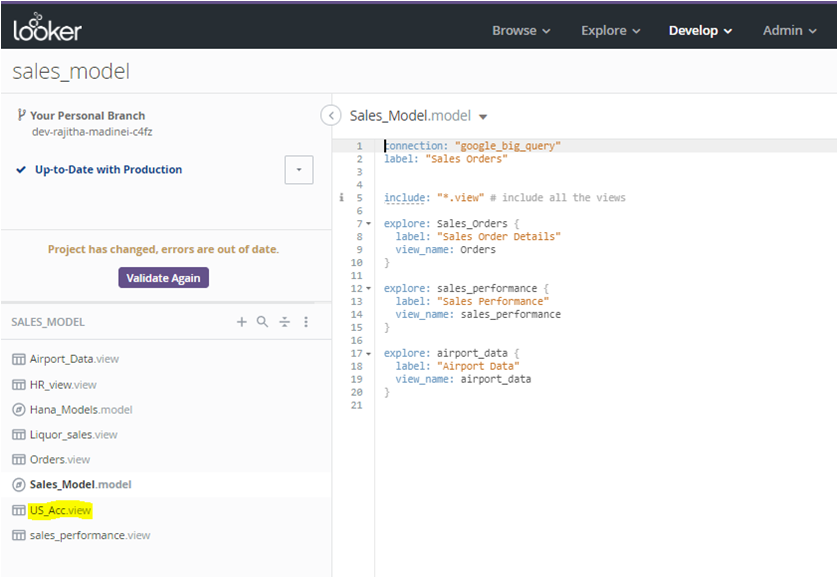
Step 8: Select the required view.
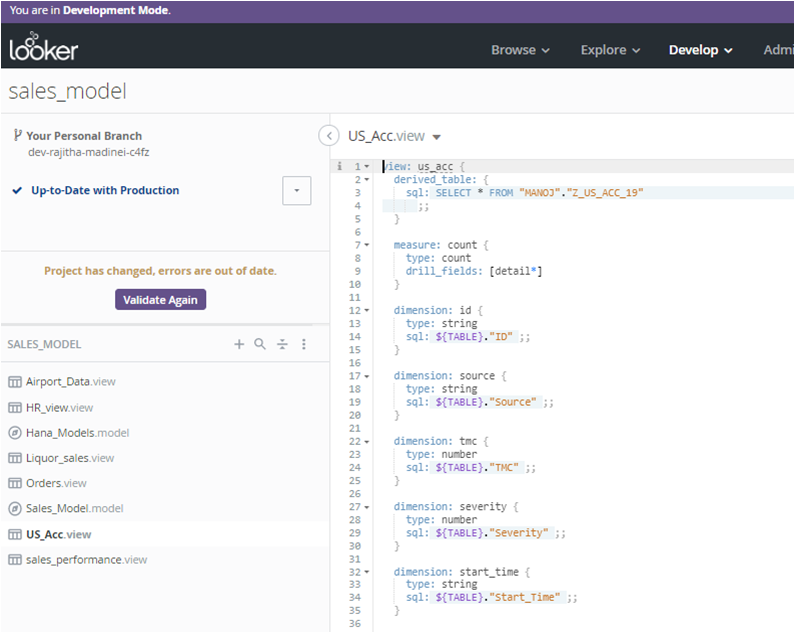
Step 9: Change the LookML code for the “Country” dimension.
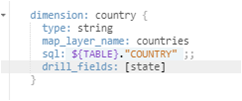
After adding the code, save the changes and execute, commit, and deploy the changes in the project.
Step 10: Exit from the development mode

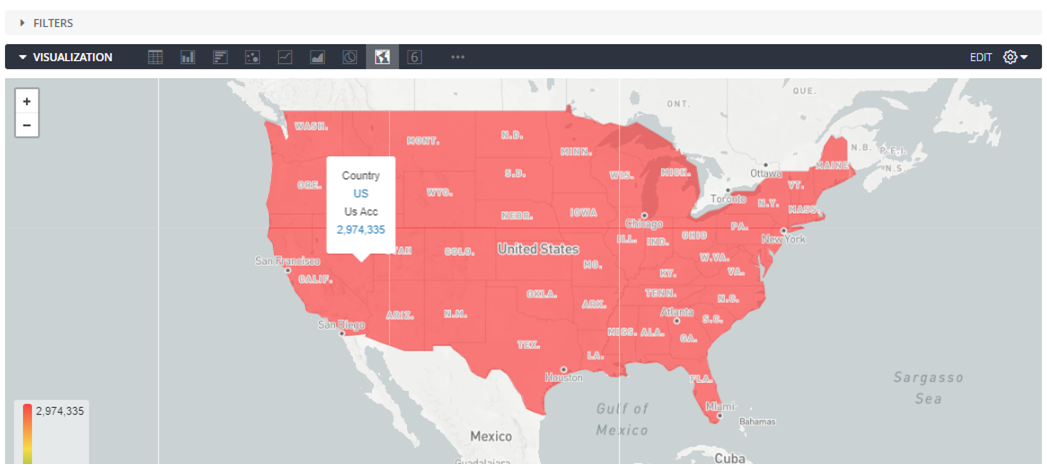
Step 11: Navigate to the project by selecting “Project” under explore menu as shown in Step 1 and select the Measure – “Count”and Dimension – “Country” and click on “Run”.
Step 12: Click on a data point and a tooltip appears as shown below.
Step 13: Click on the country name and it will display the drill through value in a drop down as shown below.
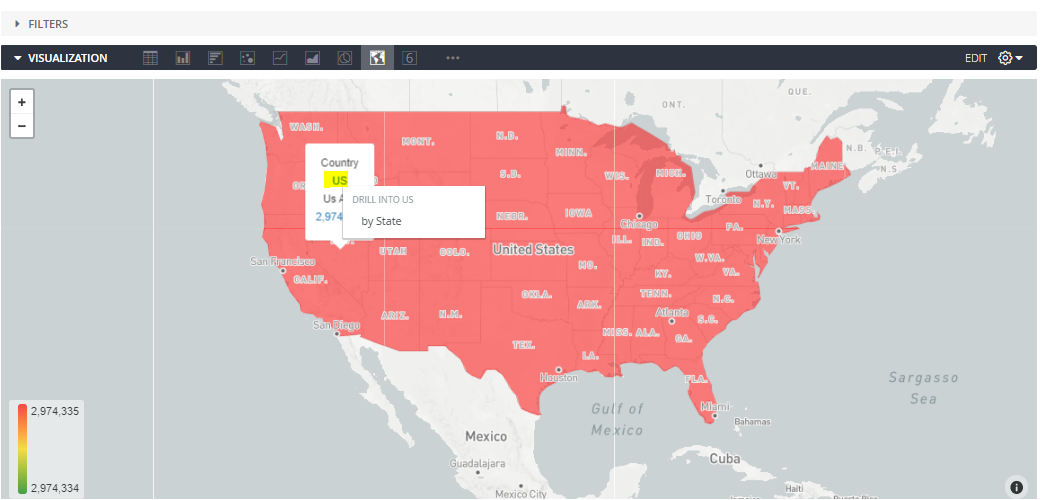
Step 14: Click on the drill through field and a pop up window with data drilled down to state appears as shown below.
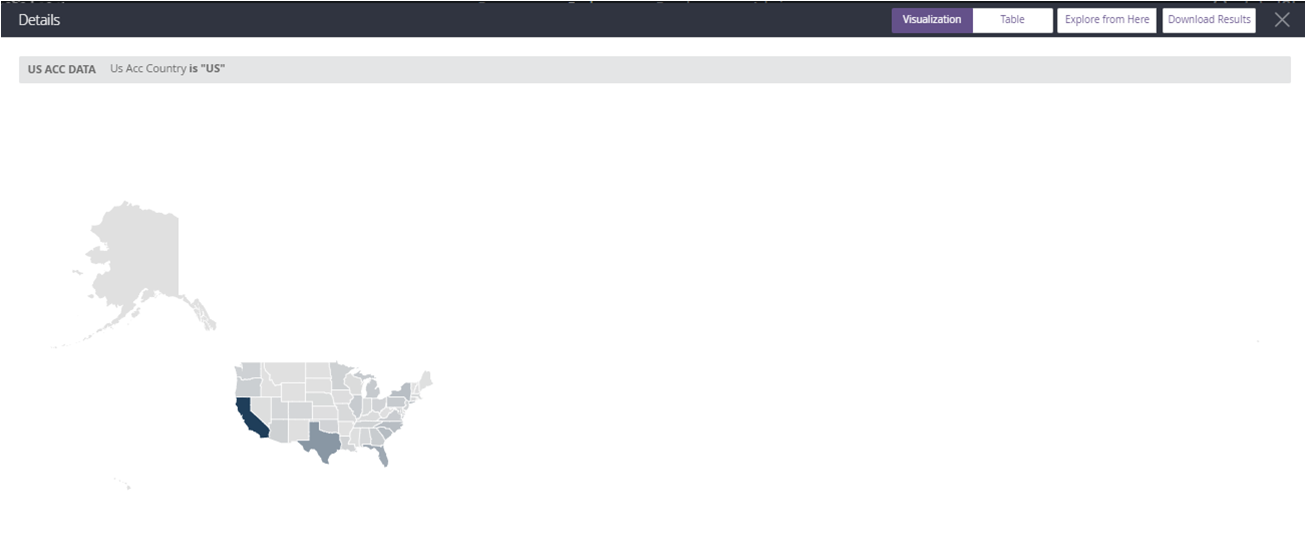
Thus we can drill down to details and analyse hierarchical and granular data points.