| Analytics , SAP Analytics Cloud ,

Now a days, all BI tools have an option to integrate R programming visuals to help data analysts create visualizations and develop complex models and calculations. In this blog, we are going to discuss as to how we can integrate and use R in SAP analytics cloud.
With R in SAP Analytics Cloud, you can:
There are two ways to run R visuals in SAP Analytics Cloud.
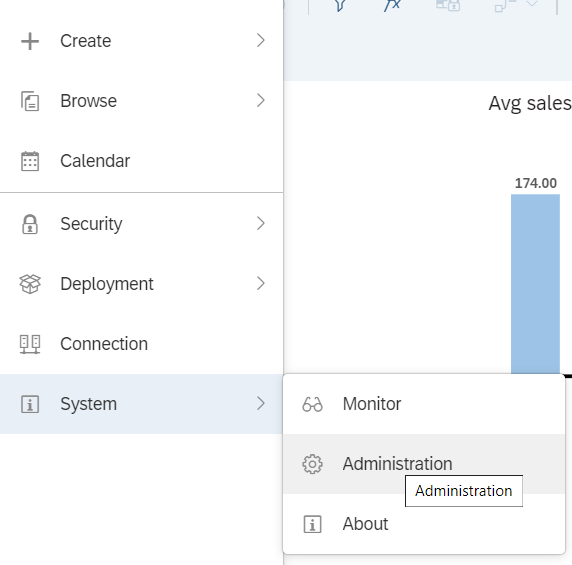
To integrate the Remote server with R server, go to System > Administration
Step 1: Select R Configuration page and click on the edit icon (top right corner of the page). Then select the “Remote R Connection” and add the Connection details to connect to remote server.
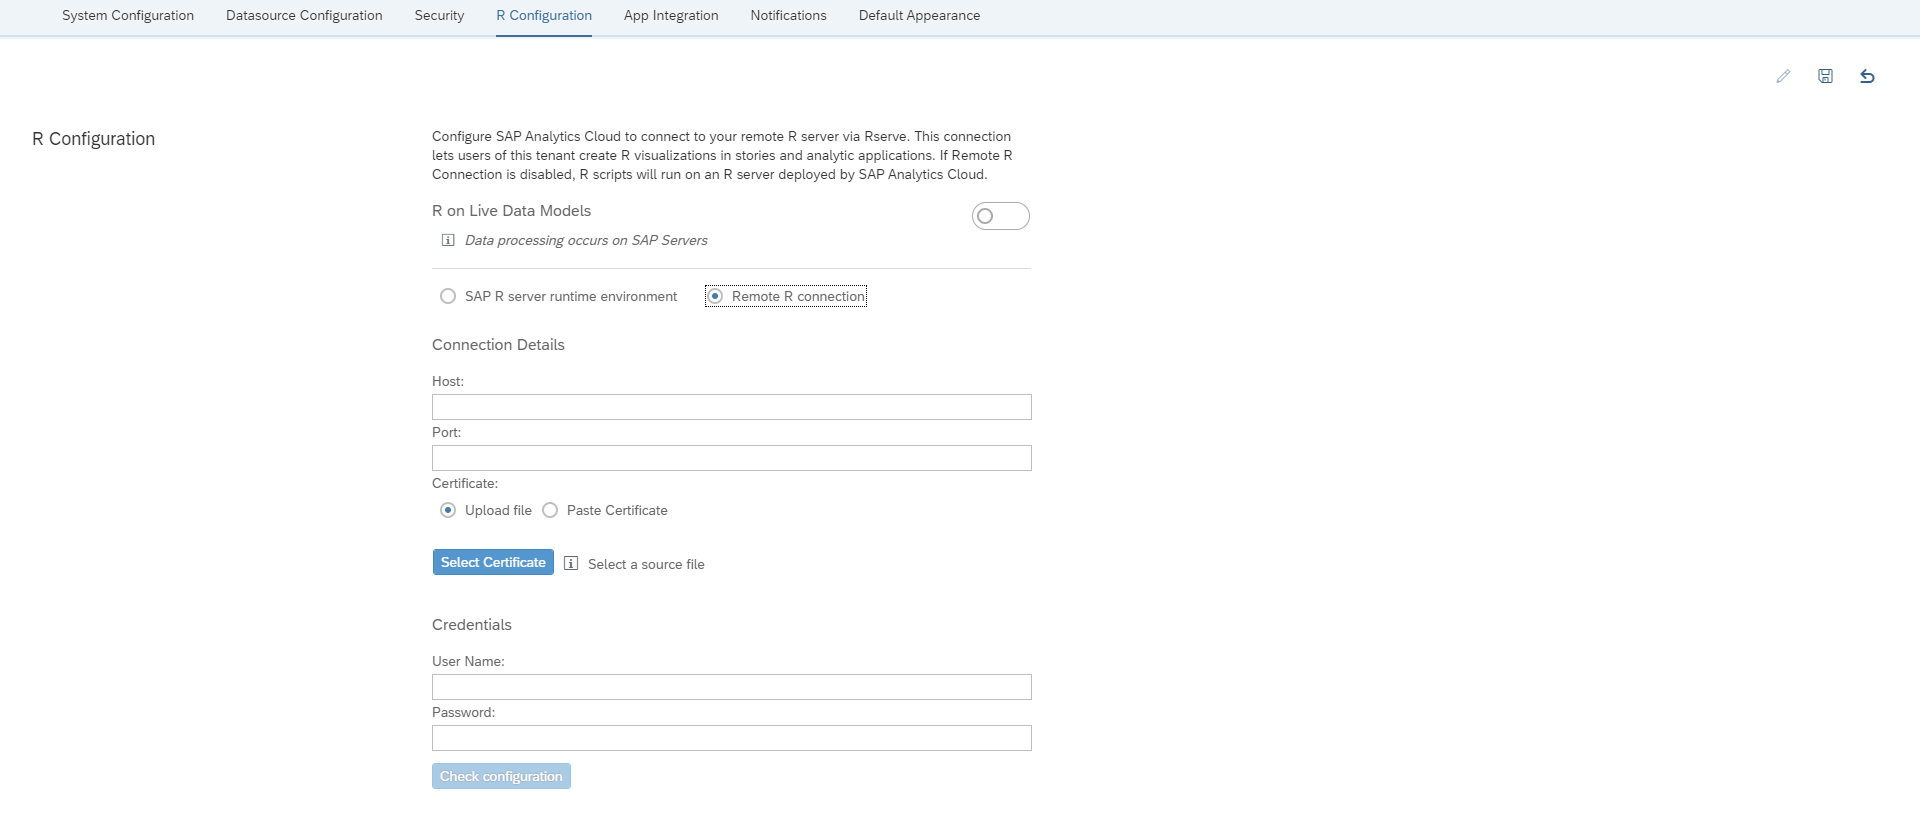
Step 2: You can also select the “SAP R server Runtime Environment”, which will help to run the R visual in SAP analytics cloud with list of R packages which are supported in SAP Analytics Cloud.
Below is the link which will give you the list of supported R packages for R server Environment.
https://www.sapanalytics.cloud/resources-r-packages/
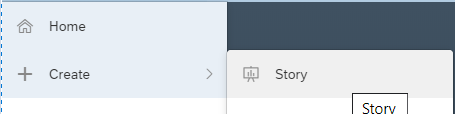
Step 3: Now go to the Home>Create >Story and select a new story to create a R visual.
Step 4: Once the story creation page opens, add a Model to Story.
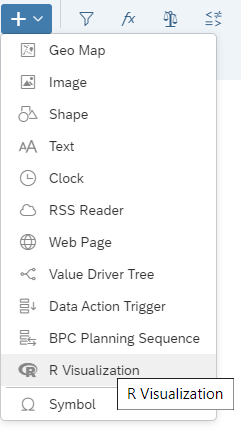
Step 5: Now go to “+” icon and select R Visualization in the list.
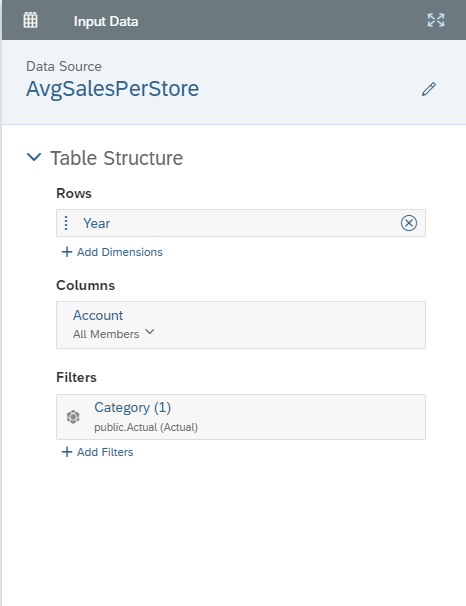
Step 6: Once the R Visualization is added, now select Designer> + Add input data and select required measures and dimensions for the R visual and click OK.
Step 7: Now select + Add Script and add the below script for a simple R visualization.
library(ggplot2)

ggplot(data=data.frame(AvgSalesPerStore),
aes(x='Avg sales per store', y='Avg sales per store growth')) +

geom_point(aes(color=Year), size=3) + ggtitle("Avg Sales per Store") +

labs(x="Avg sales per store", y="Avg sales per store growth") +

theme_bw() + theme(title=element_text(size=15, color="blue3"))
Note: Before adding your R script just mention their R Support Packages which include in the R Sever Environment in SAP analytics Cloud.
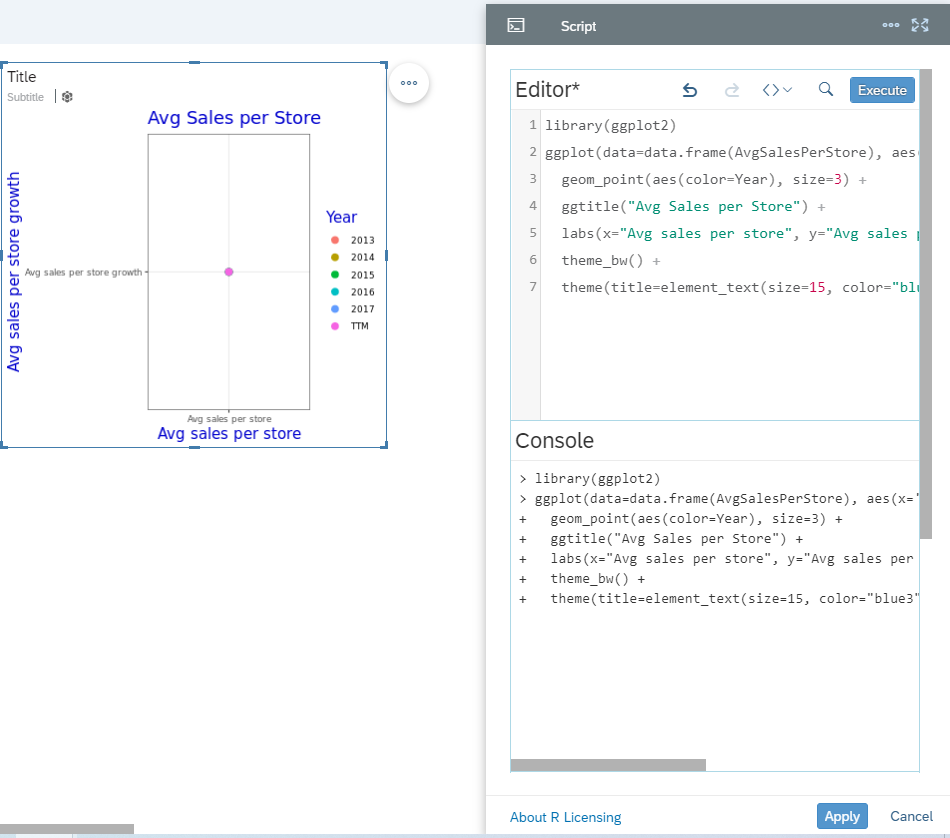
Step 8: Once you have copied the script, click on the Execute button to check if the script is running without any errors.
Now you will be able to see your R Visualization in SAP Analytics cloud. To know more about R integration with SAP Analytics Cloud, contact us.