| Analytics , SAP Analytics Cloud ,

With SAP focusing on moving towards cloud-based analytics, SAP Analytics cloud is becoming one of the hottest tools in the SAP BI space. Given that SAC is more of a self-service solution on the cloud, there was a constant business need for a professionally authored dashboarding tool on the cloud. SAP now has a solution for this – Application Design.
Application Design is very similar Lumira Designer, but on the cloud. We at Nine Boards got to work with the beta version of Application design and here is the first look of this feature in SAP Analytics Cloud.
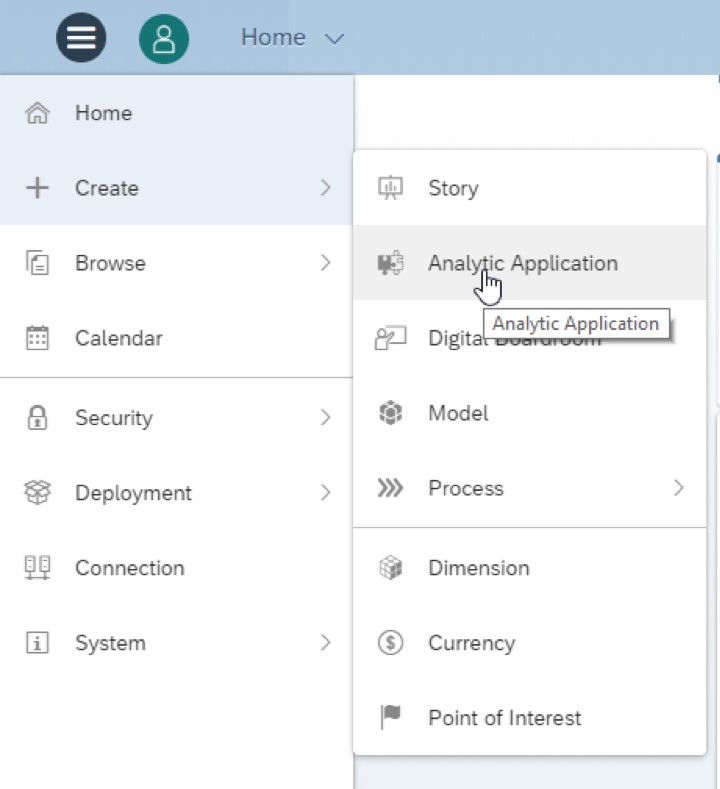
1) You can access application design like how you access the other tools on the cloud – like Story, Models etc. Click on the main menu and navigate to Create – Application design
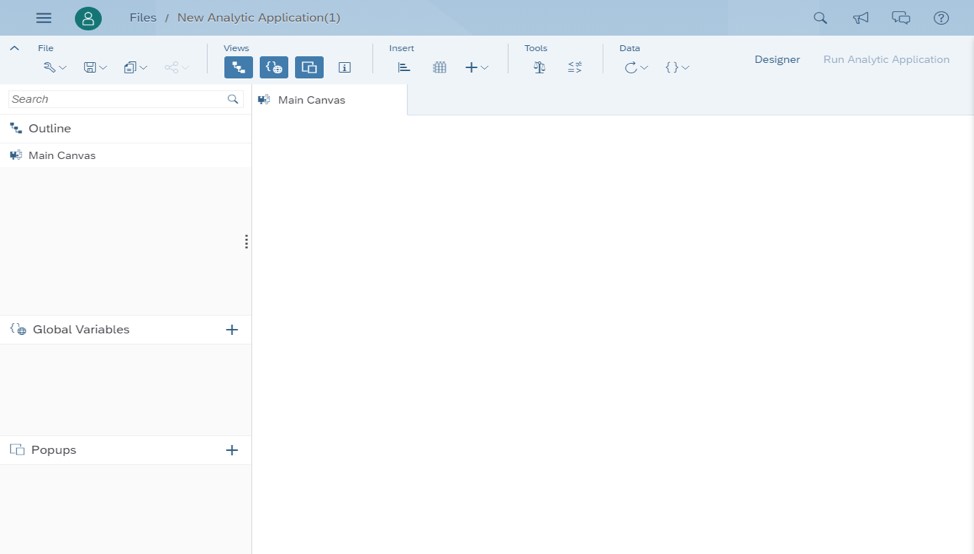
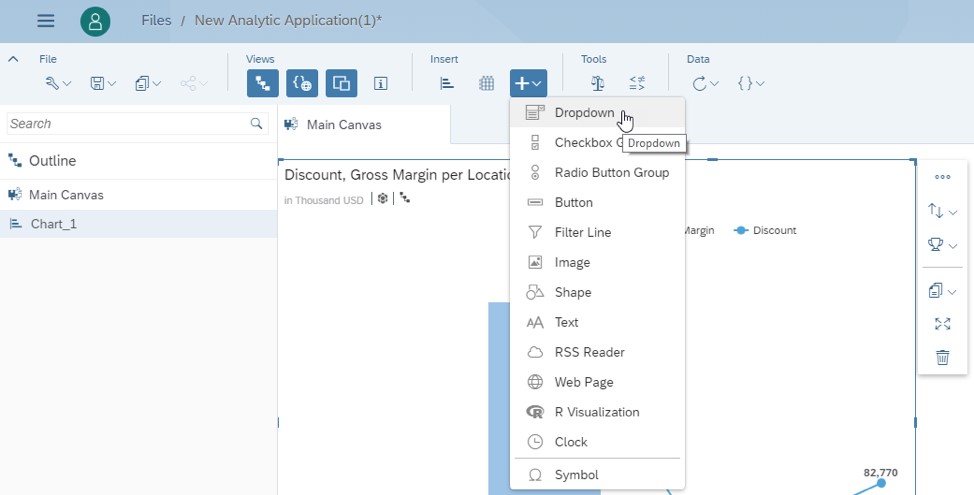
2) As you can see, it looks very similar to Lumira Designer. There is an outline panel – which lists all the components that can be added to the canvas, the designer panel allows you to customize the styling, the Global Variables panel, and the Pop Up panel. The menu at the top has the components (similar to SAC).
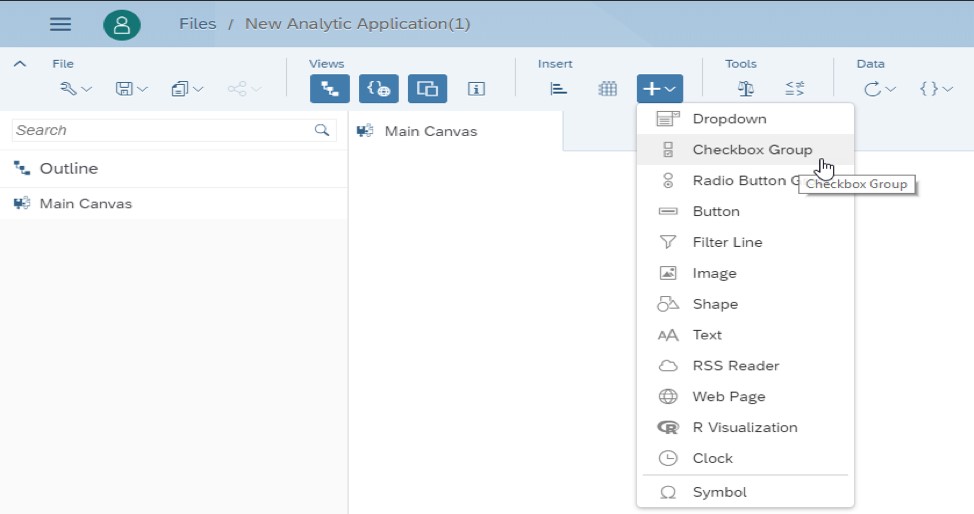
3) Currently the beta version has all the charts types and table components that are available in SAC. Additionally, there are a few widgets components like Drop down, Filter Line etc. apart from the ones that are already available in SAC.
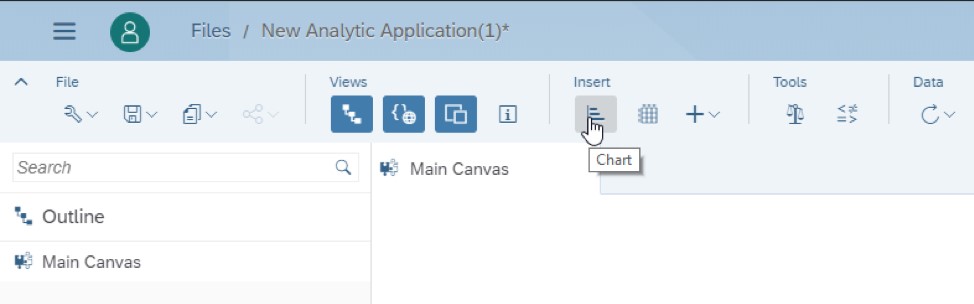
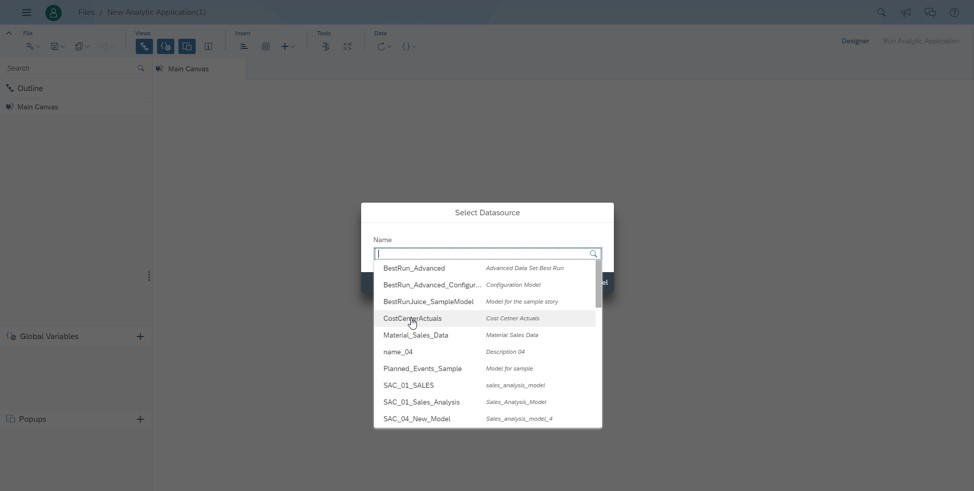
4) Next let’s add a chart to the canvas and assign a data source.
If you notice, this is very similar to SAC. Once the chart is added to the dashboard, you can select a data model from the list of already available data models and click OK.
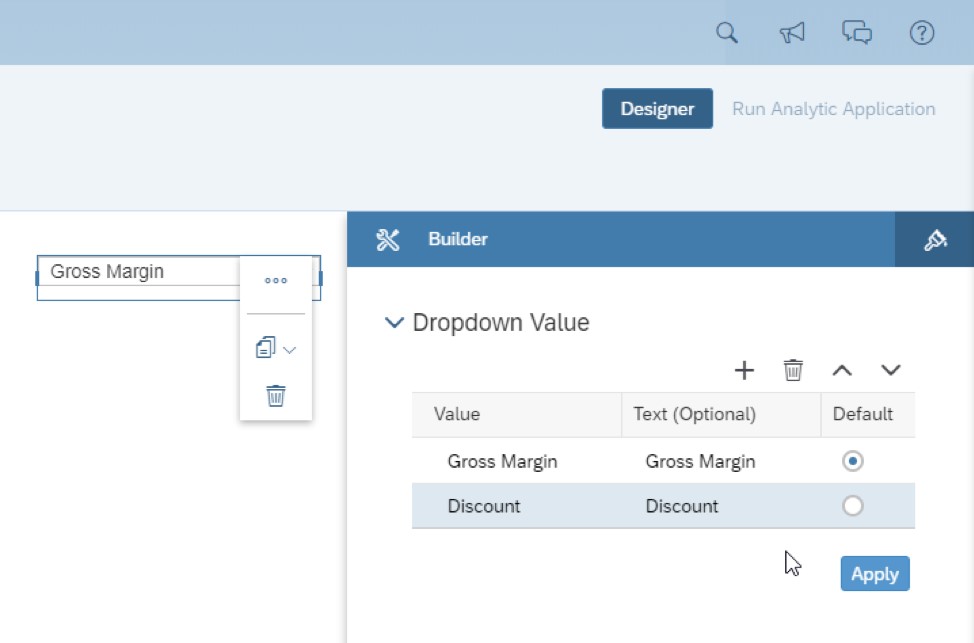
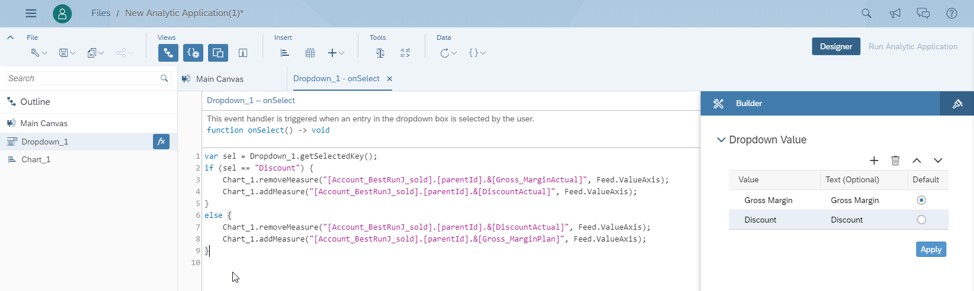
5) Next lets add a drop down to the dashboard and use this to filter key figures on the chart through scripting.
Select Dropdown widget and add it to your canvas. In the Designer panel, click on “+” (Add Value) and enter the value and text for the drop down.
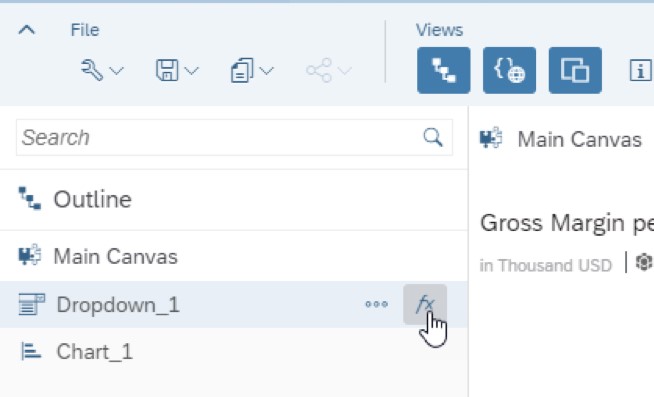
6) Now we need to add scripts to make it interact with the chart. For this, you need to hover over the component on the outline panel and you will see a small “fx” icon. Clicking on the icon will open the script editor for the On Select even of the drop down.
7) We added a simple script to show you the scripting feature. There is content assistance (Ctrl+Space) option which you can use while scripting.
NOTE: Scripting in Application Design is very similar to scripting Lumira Designer.
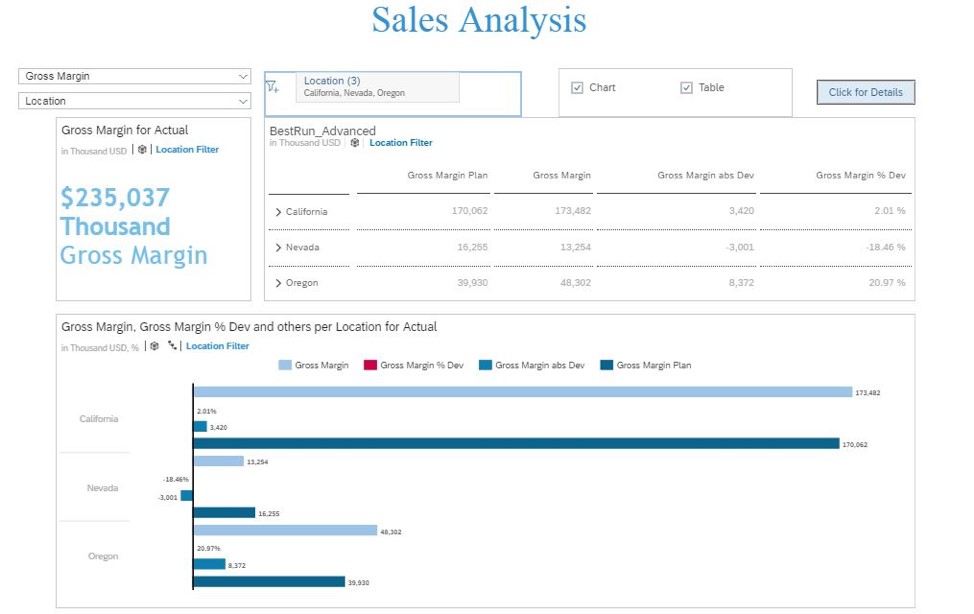
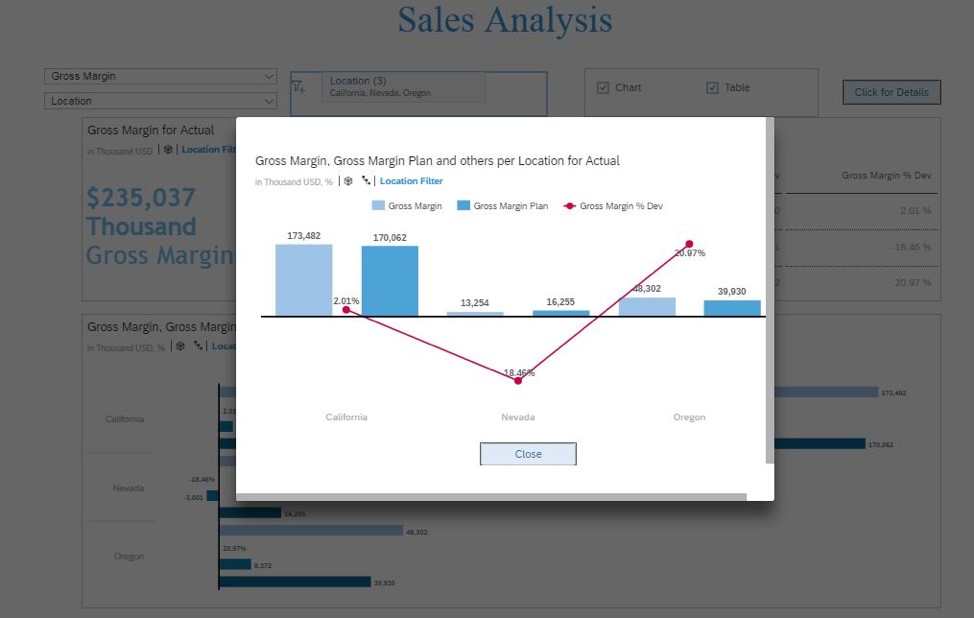
We built a simple application with some components and scripting features that are available in Application Design.
The beta version of the tool has most of the basic features that are available in Lumira Designer. There are a lot of features that are not a part of the tool yet but are planned in the future releases. For example, CSS is NOT yet supported so we have to use the inbuilt styling options available. Features like composites, etc. will be introduced in the near future so that it is a similar to Lumira Designer. Right now, SAP is not planning any migration features from Lumira Designer to application design. The approach is more towards looking at Lumira Designer as an on-premise solution and Application Design as cloud solution and businesses can choose the tool based on their needs.
Nine Boards can help you optimize your dashboard migration strategies and identify the specific services that are a fit for your business when developing dashboards. Contact us at info@nineboards.com today to learn more.