by Bala | Analytics , SAP HANA ,
In this blog, we will walk you through a steps by step process on how to expose multiple SAP HANA tables via oData. In order to create an oData service you need to create the following XS components in the repository. .xsaccess – To specify the authentication for access of package content. .xsapp – Application-descriptor file […]
by Bala | Analytics , Data Analytics , SAP Analytics Cloud ,
Linked analysis is an useful feature that allows you to dynamically interact with data. When you filter or drill down data in one chart within your story, you can trigger actions in the other related charts or tables. In this blog, I have explained the step by step procedure as to how you can create […]
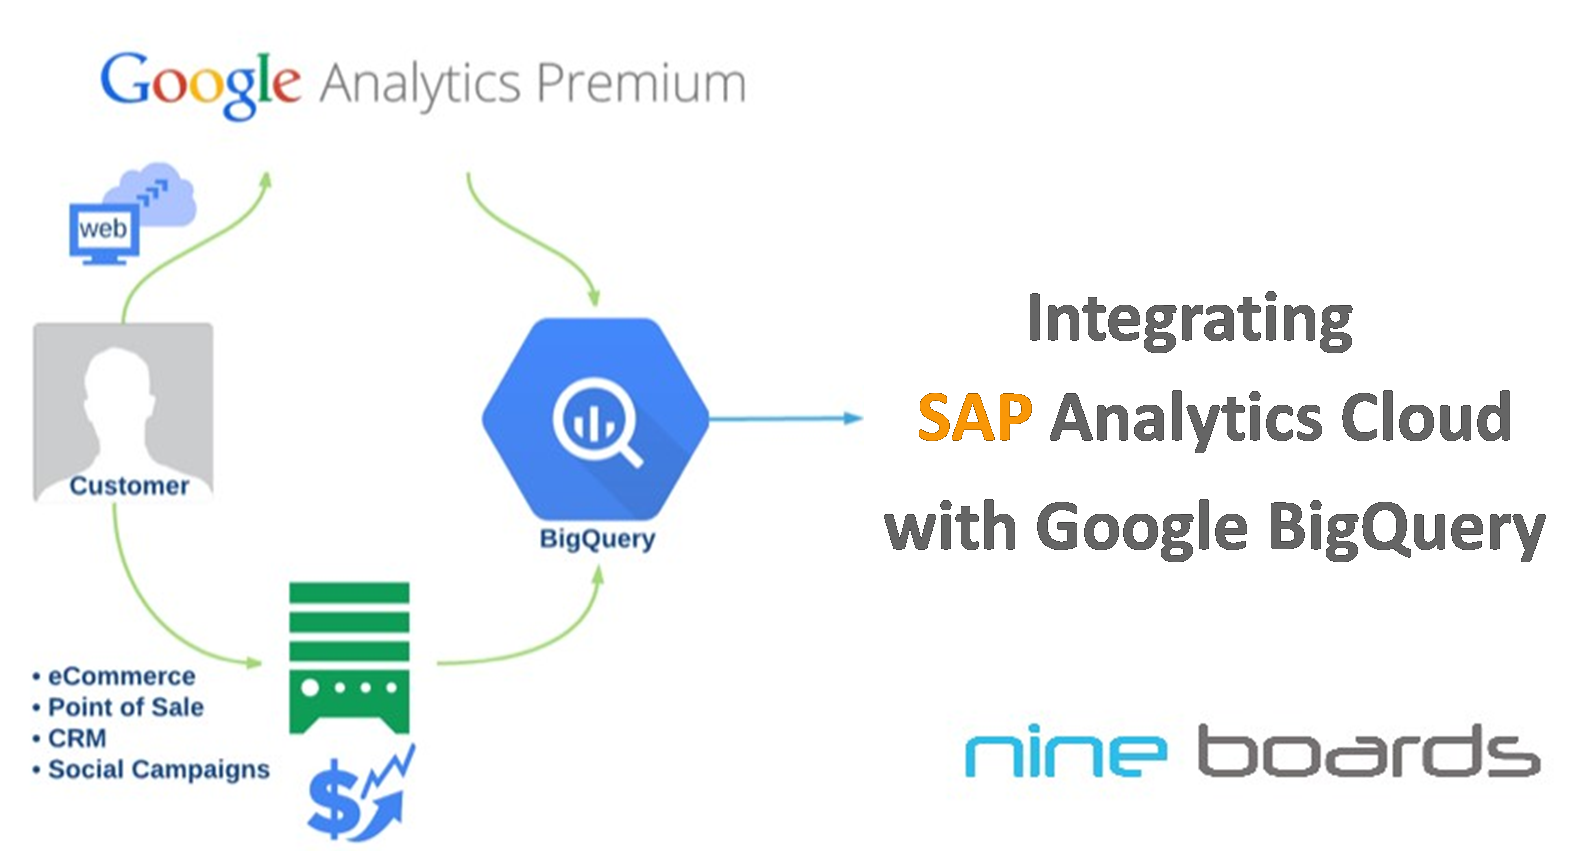
by Bala | Analytics , Google Cloud , SAP Analytics Cloud ,
Google BigQuery is a cloud based data warehouse which manages large datasets. You can now import data from Google Big Query into SAP Analytics Cloud and start building visualizations. In this blog we will discuss how to integrate Google BigQuery with SAP Analytics Cloud. Our team has successfully integrated SAP HANA with Google BigQuery, and […]
by Bala | Analytics , SAP Analytics Cloud ,
Imagine how great it would be if you can create story and visualizations by conversing with your tool. “Search to Insight” is one such feature that brings conversational AI to SAP Analytics Cloud wherein you can create a story by asking questions in natural language. This feature works by processing your natural language queries and […]
by Bala | Analytics , SAP , SAP Analytics Cloud ,
Tables are an effective way of displaying data. Highlighting important values or providing visual cues in a table enables user engagement and helps make faster decisions. This is where conditional formatting comes into play. Conditional formatting uses thresholds to provide visual cues of your information, so that you can quickly see which areas are doing […]