| Analytics , SAP Analytics Cloud ,

A Smart Discovery is the result generated by running a machine learning algorithm to uncover new or unknown relationships between columns within a dataset.
In SAP Analytics Cloud, you can choose to run a discovery against a measure or dimension within a model to determine the influencers on the focus of the discovery, how they relate to one another, and key members or value ranges. Smart Discovery also gives an overview of your data by automatically building charts to begin discovering more about your data. The guided analysis will also alert you if no significant or insightful relationships are present in your data.
Smart Discoveries are driven by users working on stories. You can exclude particular dimensions or measures from the analysis, focus on particular dimension members, and display relationships from a list of influencers. The results can be saved as story pages that you can share within your organization.
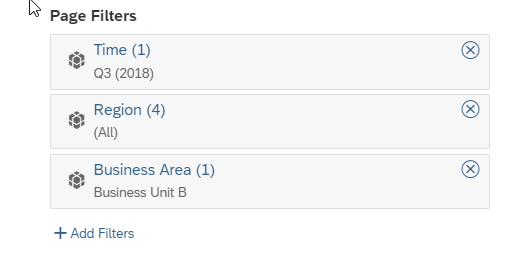
To narrow down the scope of the analysis, or to optimize running discoveries on large datasets, you can create filters to exclude specific records from dimensions in your model.
After a running a discovery, you can simulate numeric targets, using the results of the key influencer analysis. You can also view data records that are highlighted by the predictive model as being unexpected.
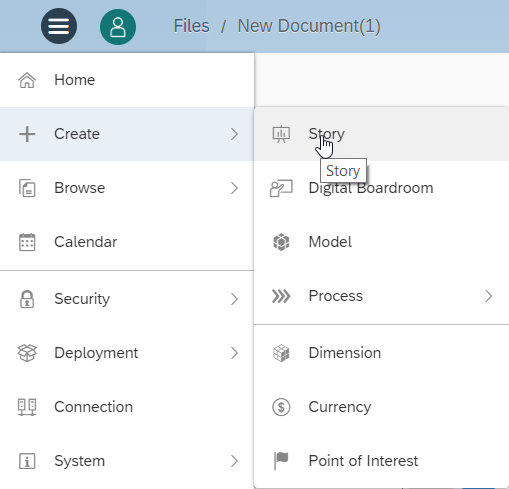
How to Create a Smart Discovery?
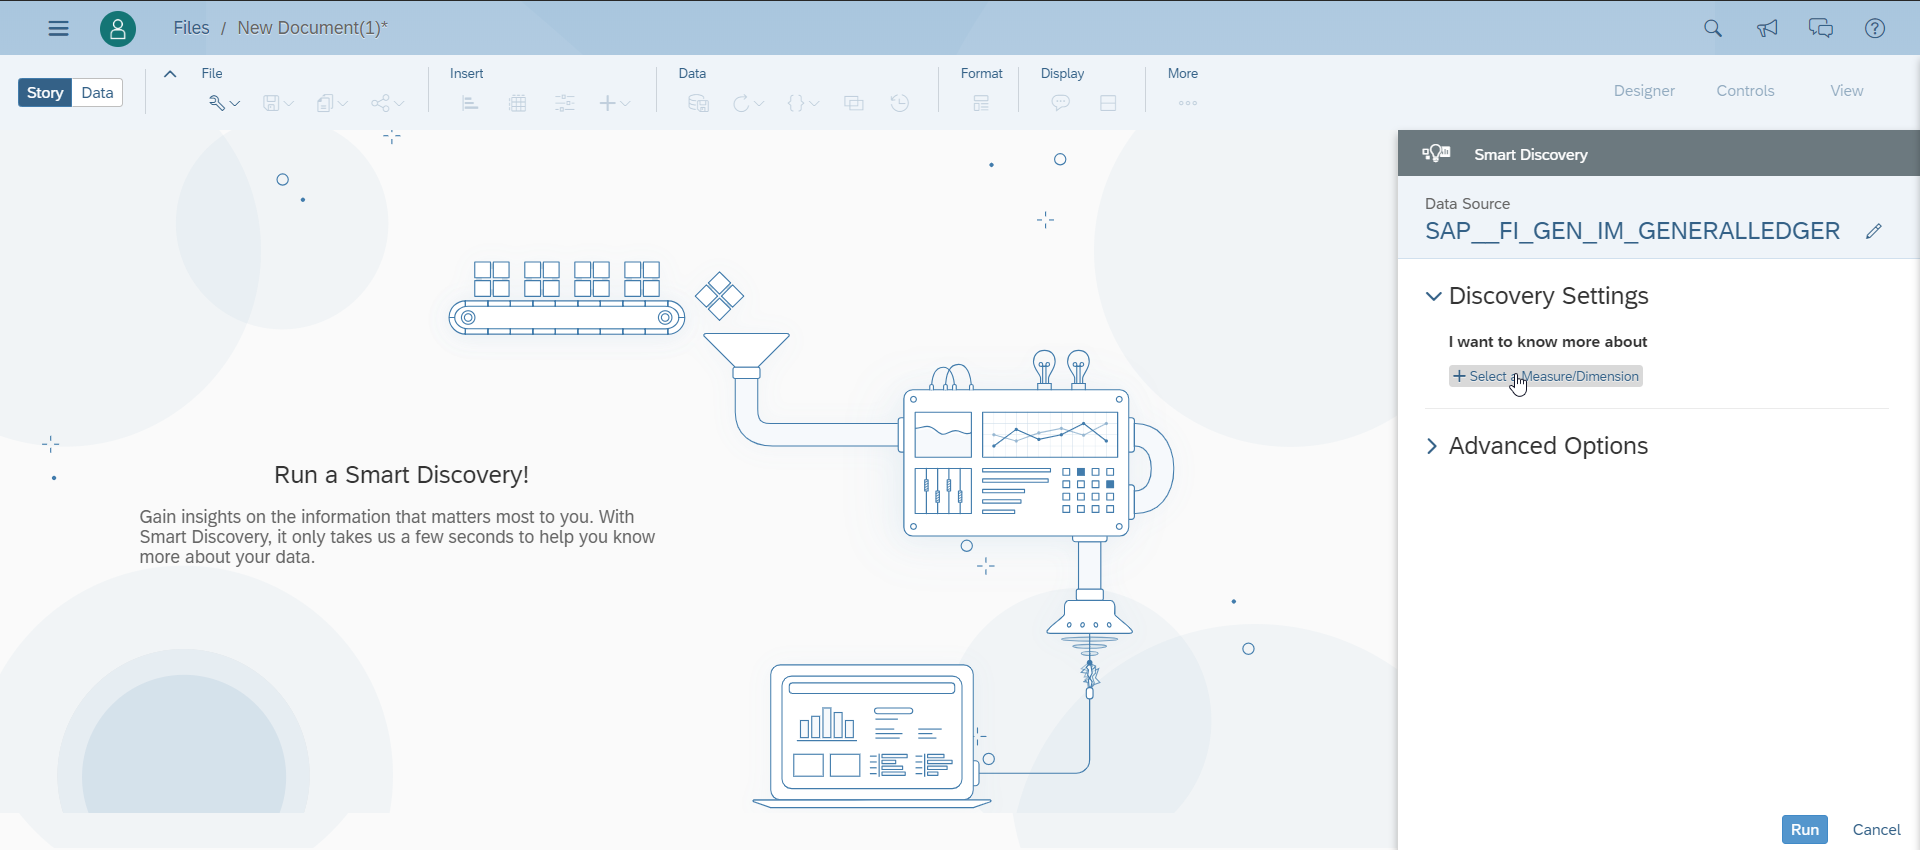
Select a model for the analysis and follow the steps illustrated below.
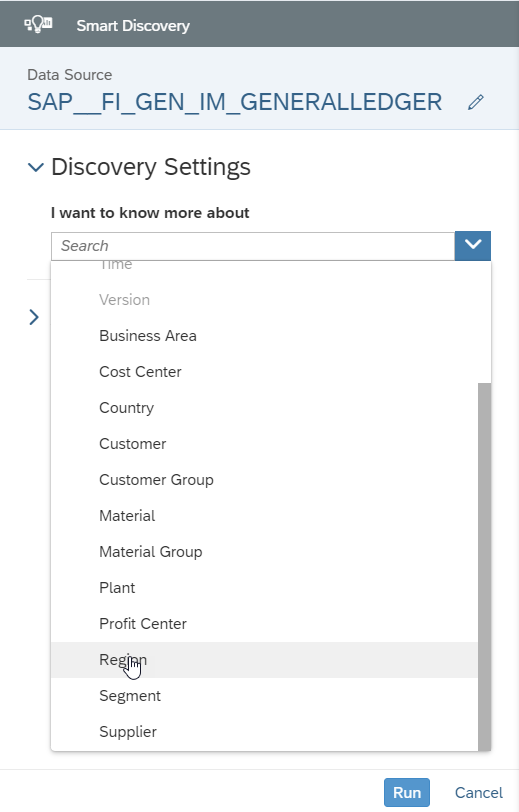
This Blog uses “SAP__FI_GEN_IM_GENERALLEDGER” for the discovery.


Classification groups: This is a set of two groups where the discovery will take them as two different members of the dimension and do the analysis. It shows the analysis by comparing one with the other.
Drag or Double click on the dimensions to move to the right(target group).

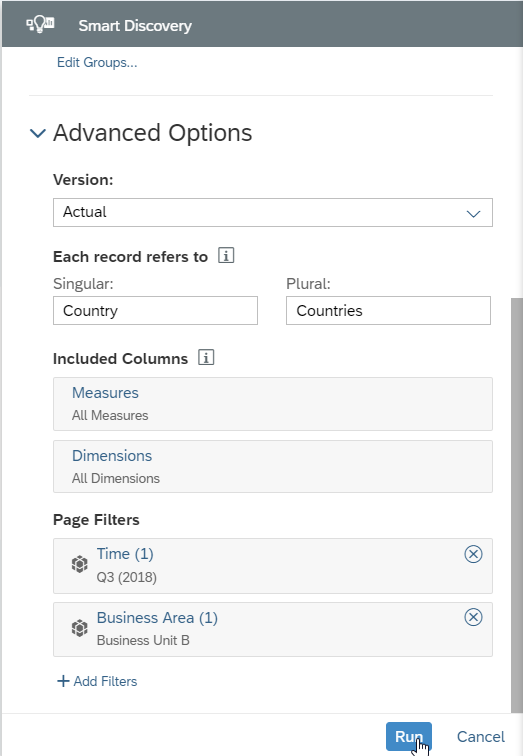
This option is to help SAP Analytics Cloud to refer to the group of members of the dimension.

Specify the columns which are required for the analysis. If all the columns have to be analysed do not select any.

Limitation of SAP Analytics Cloud: Cannot run a discovery analysis on more than one million cells.
If there is an error Data limit exceeded. Please filter some of the dimensions until the data is minimized.
This view provides a direct comparison between the two sets of countries.
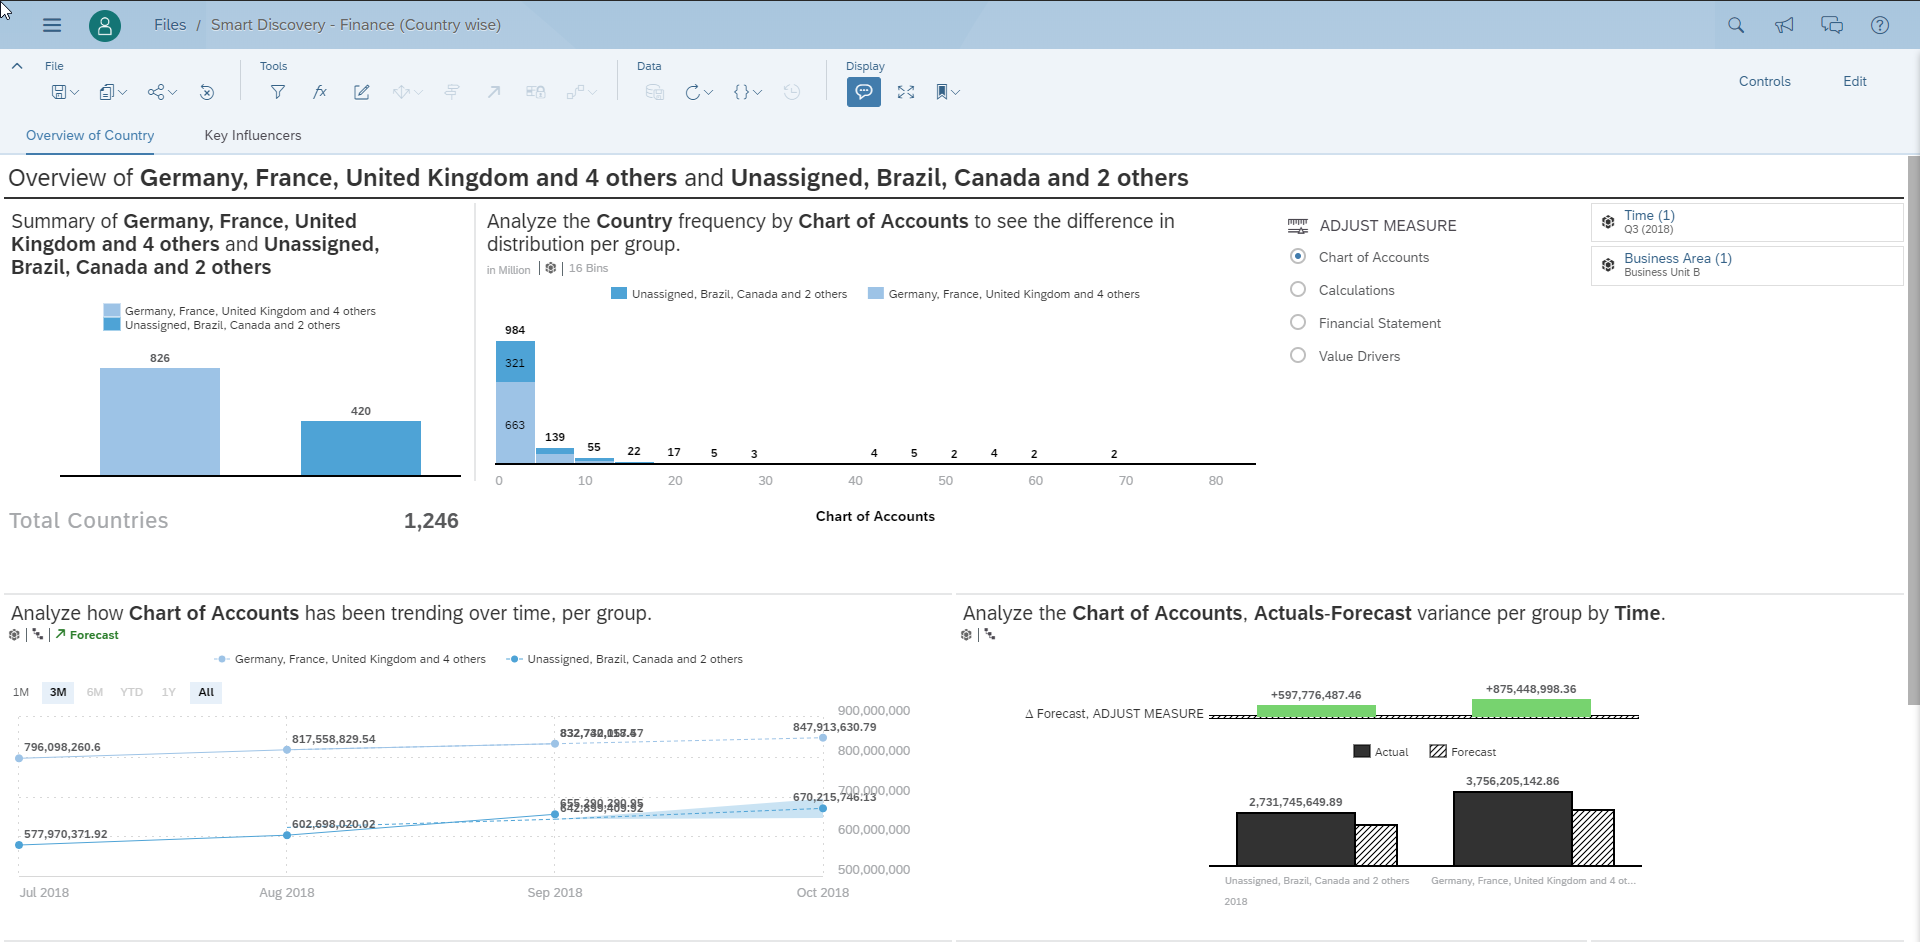
This view shows the data based on the key influencers identified by SAP Analytics Cloud.

The Smart discovery is now ready to be explored.